Immigrants from Israel vs Houma 1 or more Vehicles in Household
COMPARE
Immigrants from Israel
Houma
1 or more Vehicles in Household
1 or more Vehicles in Household Comparison
Immigrants from Israel
Houma
84.5%
1 OR MORE VEHICLES IN HOUSEHOLD
0.0/ 100
METRIC RATING
313th/ 347
METRIC RANK
88.6%
1 OR MORE VEHICLES IN HOUSEHOLD
4.8/ 100
METRIC RATING
233rd/ 347
METRIC RANK
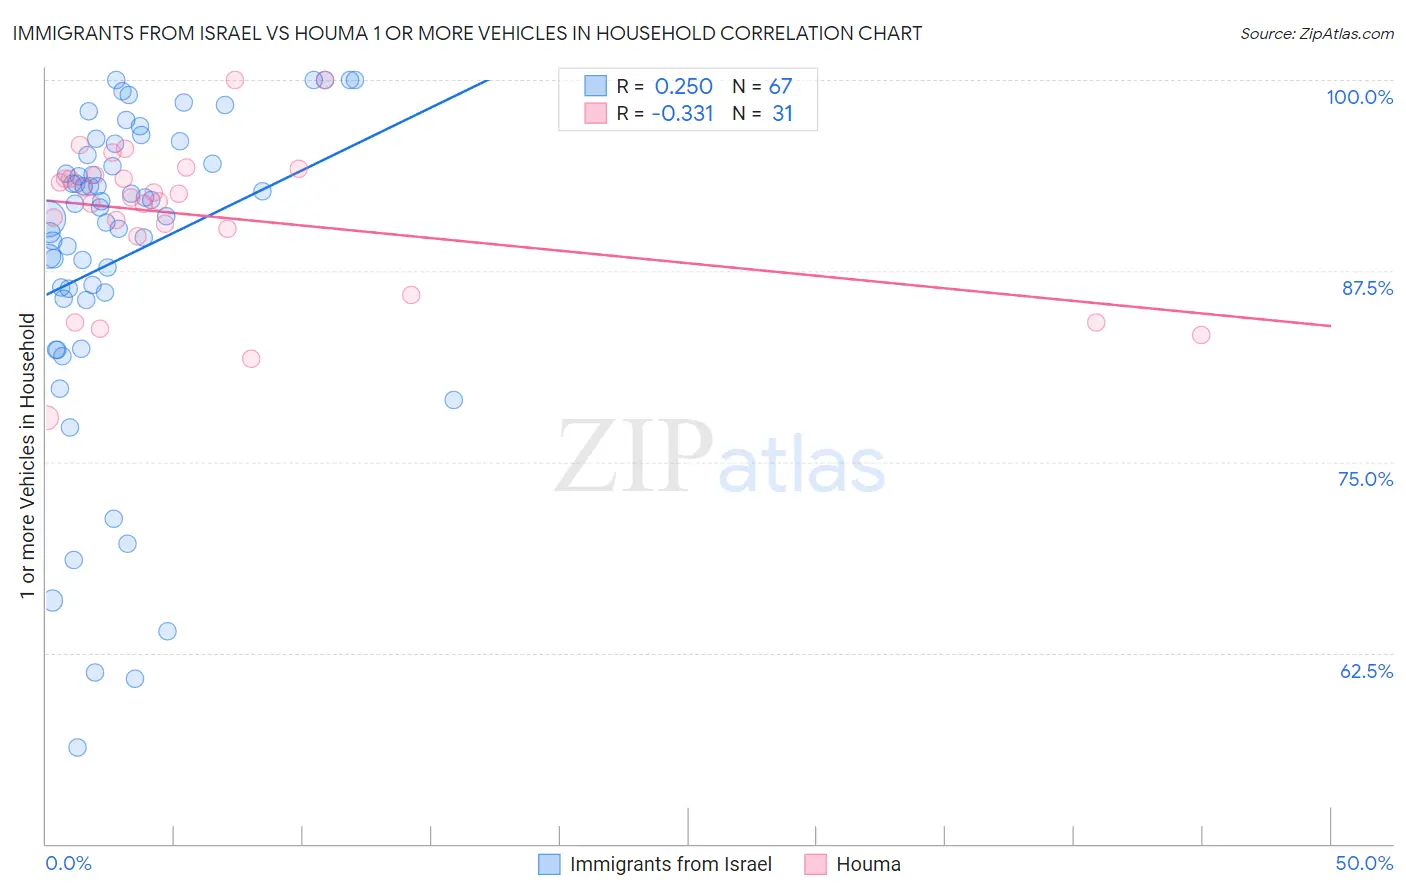
Immigrants from Israel vs Houma 1 or more Vehicles in Household Correlation Chart
The statistical analysis conducted on geographies consisting of 209,984,574 people shows a weak positive correlation between the proportion of Immigrants from Israel and percentage of households with 1 or more vehicles available in the United States with a correlation coefficient (R) of 0.250 and weighted average of 84.5%. Similarly, the statistical analysis conducted on geographies consisting of 36,796,778 people shows a mild negative correlation between the proportion of Houma and percentage of households with 1 or more vehicles available in the United States with a correlation coefficient (R) of -0.331 and weighted average of 88.6%, a difference of 4.9%.
1 or more Vehicles in Household Correlation Summary
| Measurement | Immigrants from Israel | Houma |
| Minimum | 56.3% | 77.9% |
| Maximum | 100.0% | 100.0% |
| Range | 43.7% | 22.1% |
| Mean | 88.4% | 91.0% |
| Median | 91.7% | 92.3% |
| Interquartile 25% (IQ1) | 85.7% | 89.7% |
| Interquartile 75% (IQ3) | 95.1% | 93.8% |
| Interquartile Range (IQR) | 9.4% | 4.0% |
| Standard Deviation (Sample) | 10.4% | 5.1% |
| Standard Deviation (Population) | 10.3% | 5.0% |
Similar Demographics by 1 or more Vehicles in Household
Demographics Similar to Immigrants from Israel by 1 or more Vehicles in Household
In terms of 1 or more vehicles in household, the demographic groups most similar to Immigrants from Israel are Cape Verdean (84.5%, a difference of 0.020%), Albanian (84.4%, a difference of 0.070%), Puerto Rican (84.6%, a difference of 0.13%), Cypriot (84.4%, a difference of 0.13%), and U.S. Virgin Islander (84.6%, a difference of 0.17%).
| Demographics | Rating | Rank | 1 or more Vehicles in Household |
| Immigrants | Western Africa | 0.0 /100 | #306 | Tragic 84.9% |
| Tohono O'odham | 0.0 /100 | #307 | Tragic 84.7% |
| Immigrants | Belize | 0.0 /100 | #308 | Tragic 84.7% |
| Immigrants | Haiti | 0.0 /100 | #309 | Tragic 84.7% |
| U.S. Virgin Islanders | 0.0 /100 | #310 | Tragic 84.6% |
| Puerto Ricans | 0.0 /100 | #311 | Tragic 84.6% |
| Cape Verdeans | 0.0 /100 | #312 | Tragic 84.5% |
| Immigrants | Israel | 0.0 /100 | #313 | Tragic 84.5% |
| Albanians | 0.0 /100 | #314 | Tragic 84.4% |
| Cypriots | 0.0 /100 | #315 | Tragic 84.4% |
| Alaska Natives | 0.0 /100 | #316 | Tragic 83.8% |
| Ghanaians | 0.0 /100 | #317 | Tragic 83.6% |
| Immigrants | Ghana | 0.0 /100 | #318 | Tragic 83.4% |
| Immigrants | Belarus | 0.0 /100 | #319 | Tragic 83.3% |
| Soviet Union | 0.0 /100 | #320 | Tragic 82.7% |
Demographics Similar to Houma by 1 or more Vehicles in Household
In terms of 1 or more vehicles in household, the demographic groups most similar to Houma are Immigrants from Japan (88.7%, a difference of 0.010%), Immigrants from Peru (88.6%, a difference of 0.010%), Paiute (88.6%, a difference of 0.010%), Russian (88.7%, a difference of 0.020%), and Immigrants from Pakistan (88.6%, a difference of 0.030%).
| Demographics | Rating | Rank | 1 or more Vehicles in Household |
| Cheyenne | 5.7 /100 | #226 | Tragic 88.7% |
| Ute | 5.6 /100 | #227 | Tragic 88.7% |
| Immigrants | Norway | 5.5 /100 | #228 | Tragic 88.7% |
| Immigrants | Romania | 5.4 /100 | #229 | Tragic 88.7% |
| Immigrants | Sierra Leone | 5.2 /100 | #230 | Tragic 88.7% |
| Russians | 5.0 /100 | #231 | Tragic 88.7% |
| Immigrants | Japan | 4.9 /100 | #232 | Tragic 88.7% |
| Houma | 4.8 /100 | #233 | Tragic 88.6% |
| Immigrants | Peru | 4.7 /100 | #234 | Tragic 88.6% |
| Paiute | 4.6 /100 | #235 | Tragic 88.6% |
| Immigrants | Pakistan | 4.5 /100 | #236 | Tragic 88.6% |
| Immigrants | Turkey | 4.4 /100 | #237 | Tragic 88.6% |
| Immigrants | Somalia | 4.2 /100 | #238 | Tragic 88.6% |
| Kiowa | 3.8 /100 | #239 | Tragic 88.6% |
| Eastern Europeans | 3.0 /100 | #240 | Tragic 88.5% |