Immigrants from Eastern Europe vs German 2 or more Vehicles in Household
COMPARE
Immigrants from Eastern Europe
German
2 or more Vehicles in Household
2 or more Vehicles in Household Comparison
Immigrants from Eastern Europe
Germans
51.7%
2 OR MORE VEHICLES IN HOUSEHOLD
0.1/ 100
METRIC RATING
280th/ 347
METRIC RANK
61.6%
2 OR MORE VEHICLES IN HOUSEHOLD
100.0/ 100
METRIC RATING
12th/ 347
METRIC RANK
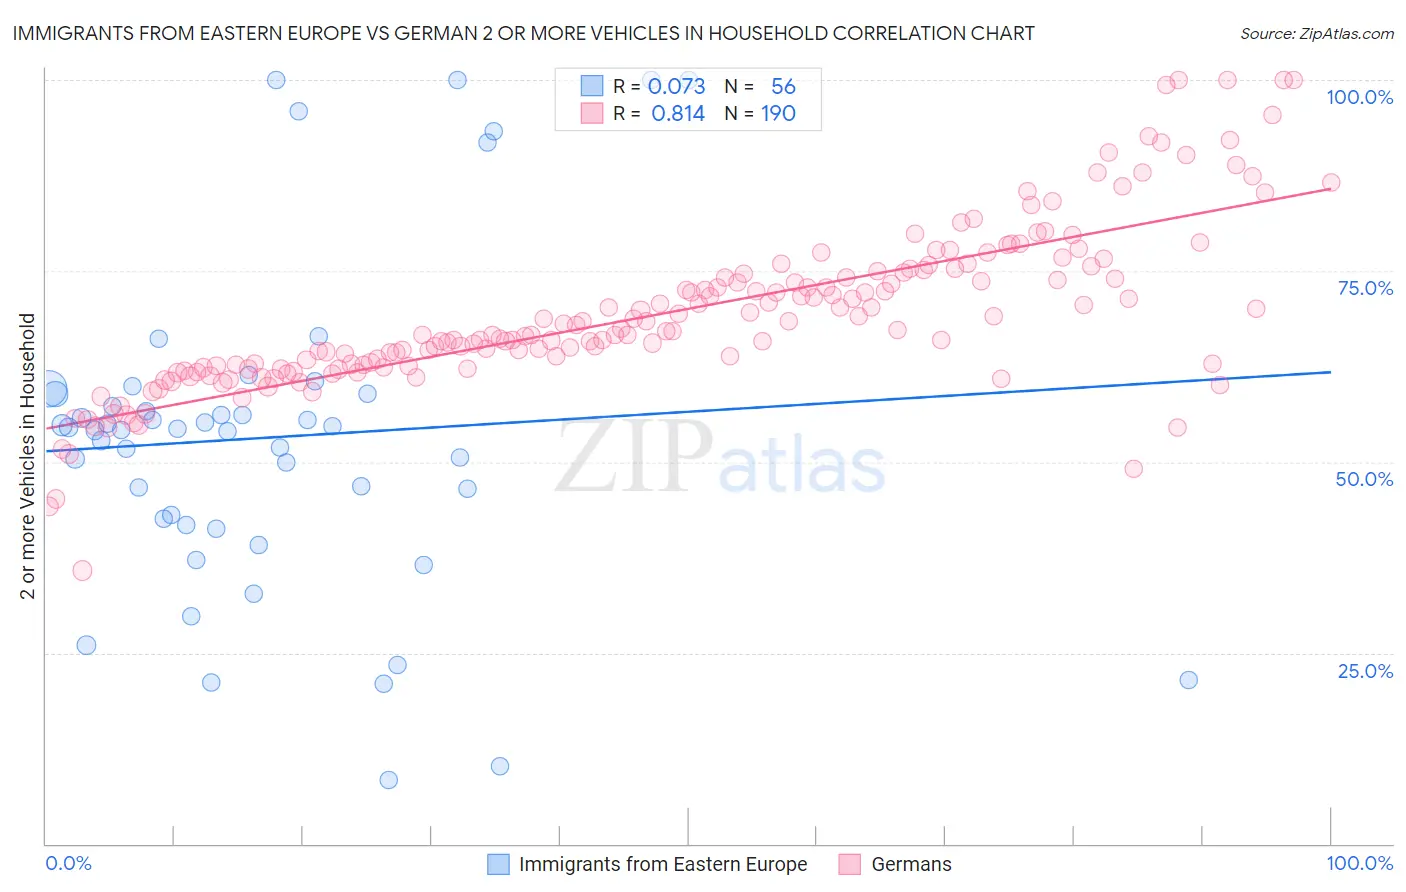
Immigrants from Eastern Europe vs German 2 or more Vehicles in Household Correlation Chart
The statistical analysis conducted on geographies consisting of 475,538,372 people shows a slight positive correlation between the proportion of Immigrants from Eastern Europe and percentage of households with 2 or more vehicles available in the United States with a correlation coefficient (R) of 0.073 and weighted average of 51.7%. Similarly, the statistical analysis conducted on geographies consisting of 580,661,137 people shows a very strong positive correlation between the proportion of Germans and percentage of households with 2 or more vehicles available in the United States with a correlation coefficient (R) of 0.814 and weighted average of 61.6%, a difference of 19.1%.
2 or more Vehicles in Household Correlation Summary
| Measurement | Immigrants from Eastern Europe | German |
| Minimum | 8.3% | 35.8% |
| Maximum | 100.0% | 100.0% |
| Range | 91.7% | 64.2% |
| Mean | 53.2% | 69.3% |
| Median | 54.2% | 67.1% |
| Interquartile 25% (IQ1) | 42.1% | 62.3% |
| Interquartile 75% (IQ3) | 58.9% | 74.6% |
| Interquartile Range (IQR) | 16.7% | 12.3% |
| Standard Deviation (Sample) | 21.5% | 10.7% |
| Standard Deviation (Population) | 21.3% | 10.7% |
Similar Demographics by 2 or more Vehicles in Household
Demographics Similar to Immigrants from Eastern Europe by 2 or more Vehicles in Household
In terms of 2 or more vehicles in household, the demographic groups most similar to Immigrants from Eastern Europe are Liberian (51.7%, a difference of 0.030%), Yuman (51.7%, a difference of 0.040%), Immigrants from Africa (51.8%, a difference of 0.11%), Immigrants from Croatia (51.8%, a difference of 0.16%), and Immigrants from Honduras (51.8%, a difference of 0.19%).
| Demographics | Rating | Rank | 2 or more Vehicles in Household |
| Israelis | 0.2 /100 | #273 | Tragic 51.9% |
| Africans | 0.2 /100 | #274 | Tragic 51.8% |
| Immigrants | Honduras | 0.2 /100 | #275 | Tragic 51.8% |
| Immigrants | Croatia | 0.2 /100 | #276 | Tragic 51.8% |
| Immigrants | Africa | 0.2 /100 | #277 | Tragic 51.8% |
| Yuman | 0.1 /100 | #278 | Tragic 51.7% |
| Liberians | 0.1 /100 | #279 | Tragic 51.7% |
| Immigrants | Eastern Europe | 0.1 /100 | #280 | Tragic 51.7% |
| Immigrants | Kazakhstan | 0.1 /100 | #281 | Tragic 51.6% |
| Bahamians | 0.1 /100 | #282 | Tragic 51.5% |
| Immigrants | China | 0.1 /100 | #283 | Tragic 51.5% |
| Immigrants | Zaire | 0.1 /100 | #284 | Tragic 51.5% |
| Immigrants | Uruguay | 0.1 /100 | #285 | Tragic 51.4% |
| Immigrants | Liberia | 0.1 /100 | #286 | Tragic 51.3% |
| Immigrants | Serbia | 0.1 /100 | #287 | Tragic 51.3% |
Demographics Similar to Germans by 2 or more Vehicles in Household
In terms of 2 or more vehicles in household, the demographic groups most similar to Germans are Dutch (61.6%, a difference of 0.11%), Samoan (61.5%, a difference of 0.12%), Czech (61.5%, a difference of 0.16%), Mexican (61.7%, a difference of 0.17%), and Nepalese (61.4%, a difference of 0.25%).
| Demographics | Rating | Rank | 2 or more Vehicles in Household |
| Immigrants | Fiji | 100.0 /100 | #5 | Exceptional 62.3% |
| Scandinavians | 100.0 /100 | #6 | Exceptional 62.1% |
| Puget Sound Salish | 100.0 /100 | #7 | Exceptional 62.1% |
| English | 100.0 /100 | #8 | Exceptional 61.9% |
| Swedes | 100.0 /100 | #9 | Exceptional 61.8% |
| Mexicans | 100.0 /100 | #10 | Exceptional 61.7% |
| Dutch | 100.0 /100 | #11 | Exceptional 61.6% |
| Germans | 100.0 /100 | #12 | Exceptional 61.6% |
| Samoans | 100.0 /100 | #13 | Exceptional 61.5% |
| Czechs | 100.0 /100 | #14 | Exceptional 61.5% |
| Nepalese | 100.0 /100 | #15 | Exceptional 61.4% |
| Native Hawaiians | 100.0 /100 | #16 | Exceptional 61.4% |
| Basques | 100.0 /100 | #17 | Exceptional 61.4% |
| Europeans | 100.0 /100 | #18 | Exceptional 61.4% |
| Scottish | 100.0 /100 | #19 | Exceptional 61.2% |