Immigrants from Eastern Europe vs Chippewa Median Male Earnings
COMPARE
Immigrants from Eastern Europe
Chippewa
Median Male Earnings
Median Male Earnings Comparison
Immigrants from Eastern Europe
Chippewa
$60,958
MEDIAN MALE EARNINGS
99.8/ 100
METRIC RATING
64th/ 347
METRIC RANK
$46,368
MEDIAN MALE EARNINGS
0.0/ 100
METRIC RATING
314th/ 347
METRIC RANK
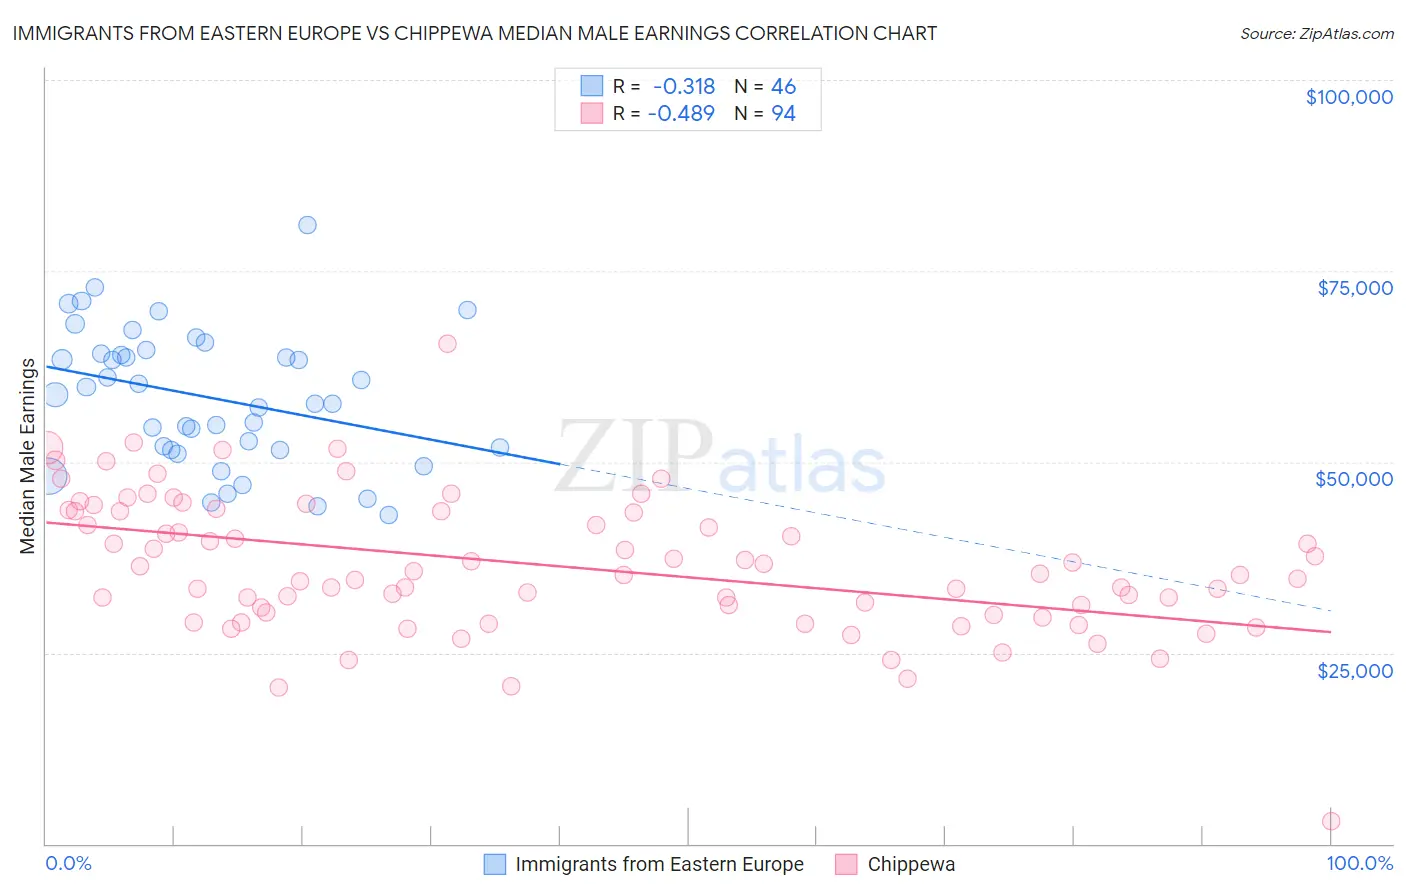
Immigrants from Eastern Europe vs Chippewa Median Male Earnings Correlation Chart
The statistical analysis conducted on geographies consisting of 475,591,188 people shows a mild negative correlation between the proportion of Immigrants from Eastern Europe and median male earnings in the United States with a correlation coefficient (R) of -0.318 and weighted average of $60,958. Similarly, the statistical analysis conducted on geographies consisting of 215,007,267 people shows a moderate negative correlation between the proportion of Chippewa and median male earnings in the United States with a correlation coefficient (R) of -0.489 and weighted average of $46,368, a difference of 31.5%.
Median Male Earnings Correlation Summary
| Measurement | Immigrants from Eastern Europe | Chippewa |
| Minimum | $43,003 | $3,000 |
| Maximum | $80,938 | $65,417 |
| Range | $37,935 | $62,417 |
| Mean | $58,399 | $36,432 |
| Median | $58,206 | $35,290 |
| Interquartile 25% (IQ1) | $51,611 | $30,344 |
| Interquartile 75% (IQ3) | $64,157 | $43,504 |
| Interquartile Range (IQR) | $12,547 | $13,160 |
| Standard Deviation (Sample) | $8,866 | $9,091 |
| Standard Deviation (Population) | $8,769 | $9,042 |
Similar Demographics by Median Male Earnings
Demographics Similar to Immigrants from Eastern Europe by Median Male Earnings
In terms of median male earnings, the demographic groups most similar to Immigrants from Eastern Europe are Immigrants from Indonesia ($60,935, a difference of 0.040%), Immigrants from Pakistan ($60,987, a difference of 0.050%), Immigrants from Croatia ($60,914, a difference of 0.070%), Immigrants from Romania ($61,040, a difference of 0.13%), and Bolivian ($61,066, a difference of 0.18%).
| Demographics | Rating | Rank | Median Male Earnings |
| Immigrants | Scotland | 99.9 /100 | #57 | Exceptional $61,220 |
| New Zealanders | 99.9 /100 | #58 | Exceptional $61,199 |
| Immigrants | Netherlands | 99.8 /100 | #59 | Exceptional $61,096 |
| Egyptians | 99.8 /100 | #60 | Exceptional $61,095 |
| Bolivians | 99.8 /100 | #61 | Exceptional $61,066 |
| Immigrants | Romania | 99.8 /100 | #62 | Exceptional $61,040 |
| Immigrants | Pakistan | 99.8 /100 | #63 | Exceptional $60,987 |
| Immigrants | Eastern Europe | 99.8 /100 | #64 | Exceptional $60,958 |
| Immigrants | Indonesia | 99.8 /100 | #65 | Exceptional $60,935 |
| Immigrants | Croatia | 99.8 /100 | #66 | Exceptional $60,914 |
| Immigrants | Spain | 99.8 /100 | #67 | Exceptional $60,750 |
| Immigrants | Serbia | 99.7 /100 | #68 | Exceptional $60,600 |
| Immigrants | Canada | 99.7 /100 | #69 | Exceptional $60,388 |
| Immigrants | Bulgaria | 99.7 /100 | #70 | Exceptional $60,358 |
| Mongolians | 99.7 /100 | #71 | Exceptional $60,350 |
Demographics Similar to Chippewa by Median Male Earnings
In terms of median male earnings, the demographic groups most similar to Chippewa are Honduran ($46,374, a difference of 0.010%), Hispanic or Latino ($46,419, a difference of 0.11%), Apache ($46,429, a difference of 0.13%), Immigrants from Guatemala ($46,244, a difference of 0.27%), and Immigrants from Caribbean ($46,193, a difference of 0.38%).
| Demographics | Rating | Rank | Median Male Earnings |
| Immigrants | Dominican Republic | 0.0 /100 | #307 | Tragic $46,655 |
| Ottawa | 0.0 /100 | #308 | Tragic $46,611 |
| Creek | 0.0 /100 | #309 | Tragic $46,594 |
| Cubans | 0.0 /100 | #310 | Tragic $46,580 |
| Apache | 0.0 /100 | #311 | Tragic $46,429 |
| Hispanics or Latinos | 0.0 /100 | #312 | Tragic $46,419 |
| Hondurans | 0.0 /100 | #313 | Tragic $46,374 |
| Chippewa | 0.0 /100 | #314 | Tragic $46,368 |
| Immigrants | Guatemala | 0.0 /100 | #315 | Tragic $46,244 |
| Immigrants | Caribbean | 0.0 /100 | #316 | Tragic $46,193 |
| Mexicans | 0.0 /100 | #317 | Tragic $46,147 |
| Cheyenne | 0.0 /100 | #318 | Tragic $46,062 |
| Haitians | 0.0 /100 | #319 | Tragic $45,903 |
| Immigrants | Honduras | 0.0 /100 | #320 | Tragic $45,787 |
| Fijians | 0.0 /100 | #321 | Tragic $45,607 |