Immigrants from Denmark vs Immigrants from Europe 4 or more Vehicles in Household
COMPARE
Immigrants from Denmark
Immigrants from Europe
4 or more Vehicles in Household
4 or more Vehicles in Household Comparison
Immigrants from Denmark
Immigrants from Europe
6.4%
4 OR MORE VEHICLES IN HOUSEHOLD
57.8/ 100
METRIC RATING
166th/ 347
METRIC RANK
5.7%
4 OR MORE VEHICLES IN HOUSEHOLD
2.3/ 100
METRIC RATING
250th/ 347
METRIC RANK
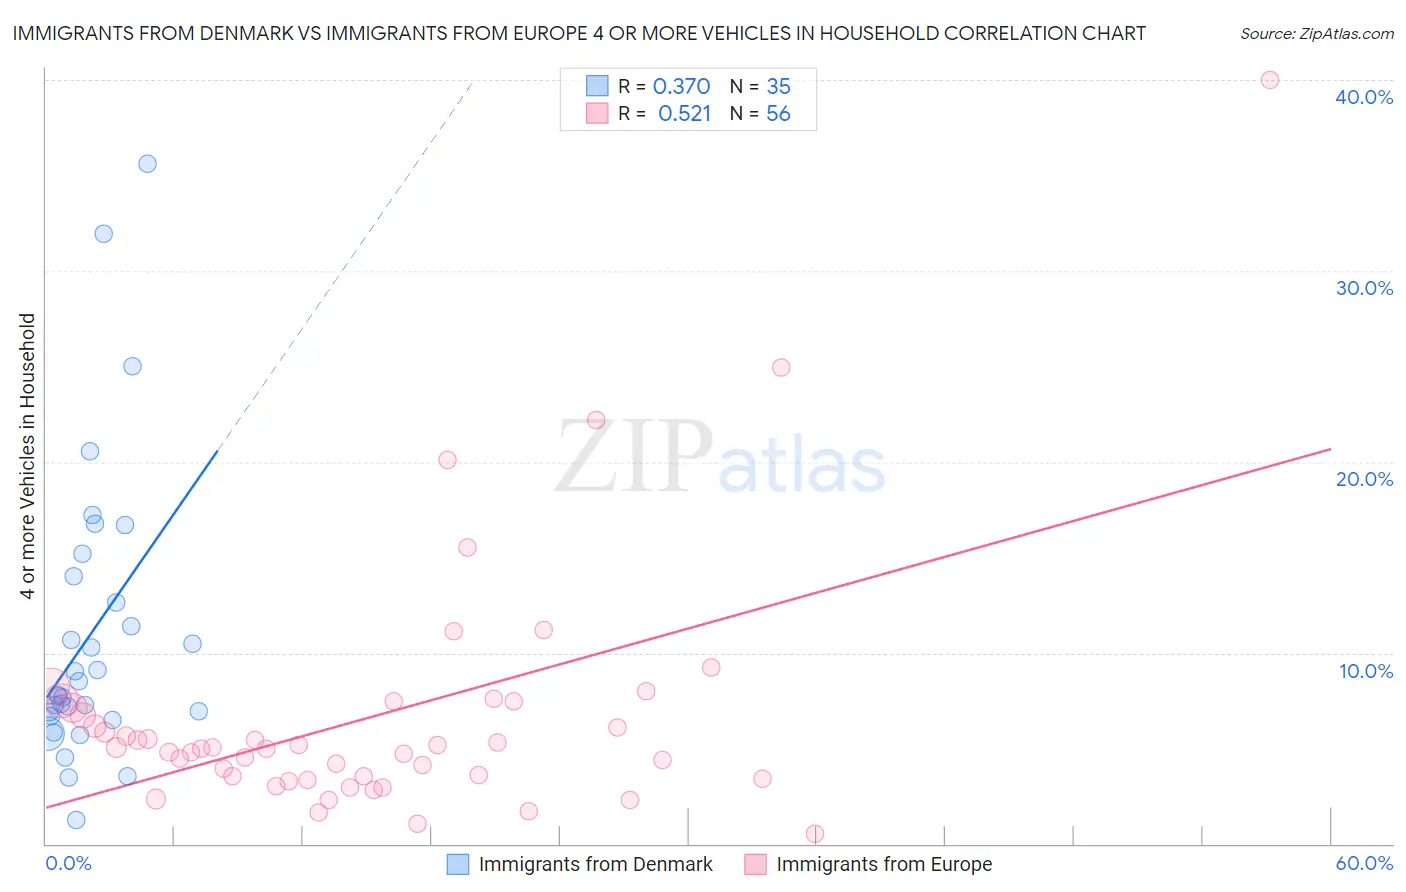
Immigrants from Denmark vs Immigrants from Europe 4 or more Vehicles in Household Correlation Chart
The statistical analysis conducted on geographies consisting of 135,941,579 people shows a mild positive correlation between the proportion of Immigrants from Denmark and percentage of households with 4 or more vehicles available in the United States with a correlation coefficient (R) of 0.370 and weighted average of 6.4%. Similarly, the statistical analysis conducted on geographies consisting of 544,257,144 people shows a substantial positive correlation between the proportion of Immigrants from Europe and percentage of households with 4 or more vehicles available in the United States with a correlation coefficient (R) of 0.521 and weighted average of 5.7%, a difference of 11.4%.
4 or more Vehicles in Household Correlation Summary
| Measurement | Immigrants from Denmark | Immigrants from Europe |
| Minimum | 1.2% | 0.50% |
| Maximum | 35.6% | 40.0% |
| Range | 34.4% | 39.5% |
| Mean | 11.0% | 6.7% |
| Median | 7.8% | 5.0% |
| Interquartile 25% (IQ1) | 6.7% | 3.5% |
| Interquartile 75% (IQ3) | 14.0% | 7.3% |
| Interquartile Range (IQR) | 7.3% | 3.8% |
| Standard Deviation (Sample) | 7.6% | 6.6% |
| Standard Deviation (Population) | 7.5% | 6.5% |
Similar Demographics by 4 or more Vehicles in Household
Demographics Similar to Immigrants from Denmark by 4 or more Vehicles in Household
In terms of 4 or more vehicles in household, the demographic groups most similar to Immigrants from Denmark are Polish (6.4%, a difference of 0.10%), Lebanese (6.4%, a difference of 0.20%), Immigrants from Peru (6.4%, a difference of 0.21%), Estonian (6.4%, a difference of 0.28%), and Chilean (6.4%, a difference of 0.35%).
| Demographics | Rating | Rank | 4 or more Vehicles in Household |
| Indians (Asian) | 66.3 /100 | #159 | Good 6.4% |
| Palestinians | 65.8 /100 | #160 | Good 6.4% |
| Immigrants | Cameroon | 64.4 /100 | #161 | Good 6.4% |
| Immigrants | Pakistan | 63.2 /100 | #162 | Good 6.4% |
| Chileans | 61.2 /100 | #163 | Good 6.4% |
| Hungarians | 61.1 /100 | #164 | Good 6.4% |
| Immigrants | Peru | 59.8 /100 | #165 | Average 6.4% |
| Immigrants | Denmark | 57.8 /100 | #166 | Average 6.4% |
| Poles | 56.9 /100 | #167 | Average 6.4% |
| Lebanese | 55.8 /100 | #168 | Average 6.4% |
| Estonians | 55.1 /100 | #169 | Average 6.4% |
| Immigrants | Syria | 52.8 /100 | #170 | Average 6.3% |
| Immigrants | India | 51.9 /100 | #171 | Average 6.3% |
| Immigrants | Lebanon | 51.7 /100 | #172 | Average 6.3% |
| Slovenes | 51.1 /100 | #173 | Average 6.3% |
Demographics Similar to Immigrants from Europe by 4 or more Vehicles in Household
In terms of 4 or more vehicles in household, the demographic groups most similar to Immigrants from Europe are Ugandan (5.7%, a difference of 0.020%), Immigrants from Southern Europe (5.7%, a difference of 0.10%), Immigrants from Eastern Africa (5.7%, a difference of 0.12%), Immigrants from Ethiopia (5.7%, a difference of 0.23%), and Subsaharan African (5.7%, a difference of 0.25%).
| Demographics | Rating | Rank | 4 or more Vehicles in Household |
| Immigrants | Czechoslovakia | 3.2 /100 | #243 | Tragic 5.8% |
| Ethiopians | 3.2 /100 | #244 | Tragic 5.8% |
| Bulgarians | 3.1 /100 | #245 | Tragic 5.8% |
| Immigrants | North Macedonia | 2.5 /100 | #246 | Tragic 5.7% |
| Immigrants | Ethiopia | 2.4 /100 | #247 | Tragic 5.7% |
| Immigrants | Eastern Africa | 2.4 /100 | #248 | Tragic 5.7% |
| Immigrants | Southern Europe | 2.3 /100 | #249 | Tragic 5.7% |
| Immigrants | Europe | 2.3 /100 | #250 | Tragic 5.7% |
| Ugandans | 2.2 /100 | #251 | Tragic 5.7% |
| Sub-Saharan Africans | 2.1 /100 | #252 | Tragic 5.7% |
| Immigrants | Cuba | 1.6 /100 | #253 | Tragic 5.7% |
| Immigrants | Panama | 1.5 /100 | #254 | Tragic 5.7% |
| Yup'ik | 1.5 /100 | #255 | Tragic 5.7% |
| Immigrants | Turkey | 1.5 /100 | #256 | Tragic 5.7% |
| Immigrants | Northern Africa | 1.4 /100 | #257 | Tragic 5.6% |