Immigrants from Denmark vs Immigrants from Western Asia Householder Income Under 25 years
COMPARE
Immigrants from Denmark
Immigrants from Western Asia
Householder Income Under 25 years
Householder Income Under 25 years Comparison
Immigrants from Denmark
Immigrants from Western Asia
$52,612
HOUSEHOLDER INCOME UNDER 25 YEARS
73.8/ 100
METRIC RATING
155th/ 347
METRIC RANK
$52,190
HOUSEHOLDER INCOME UNDER 25 YEARS
50.0/ 100
METRIC RATING
174th/ 347
METRIC RANK
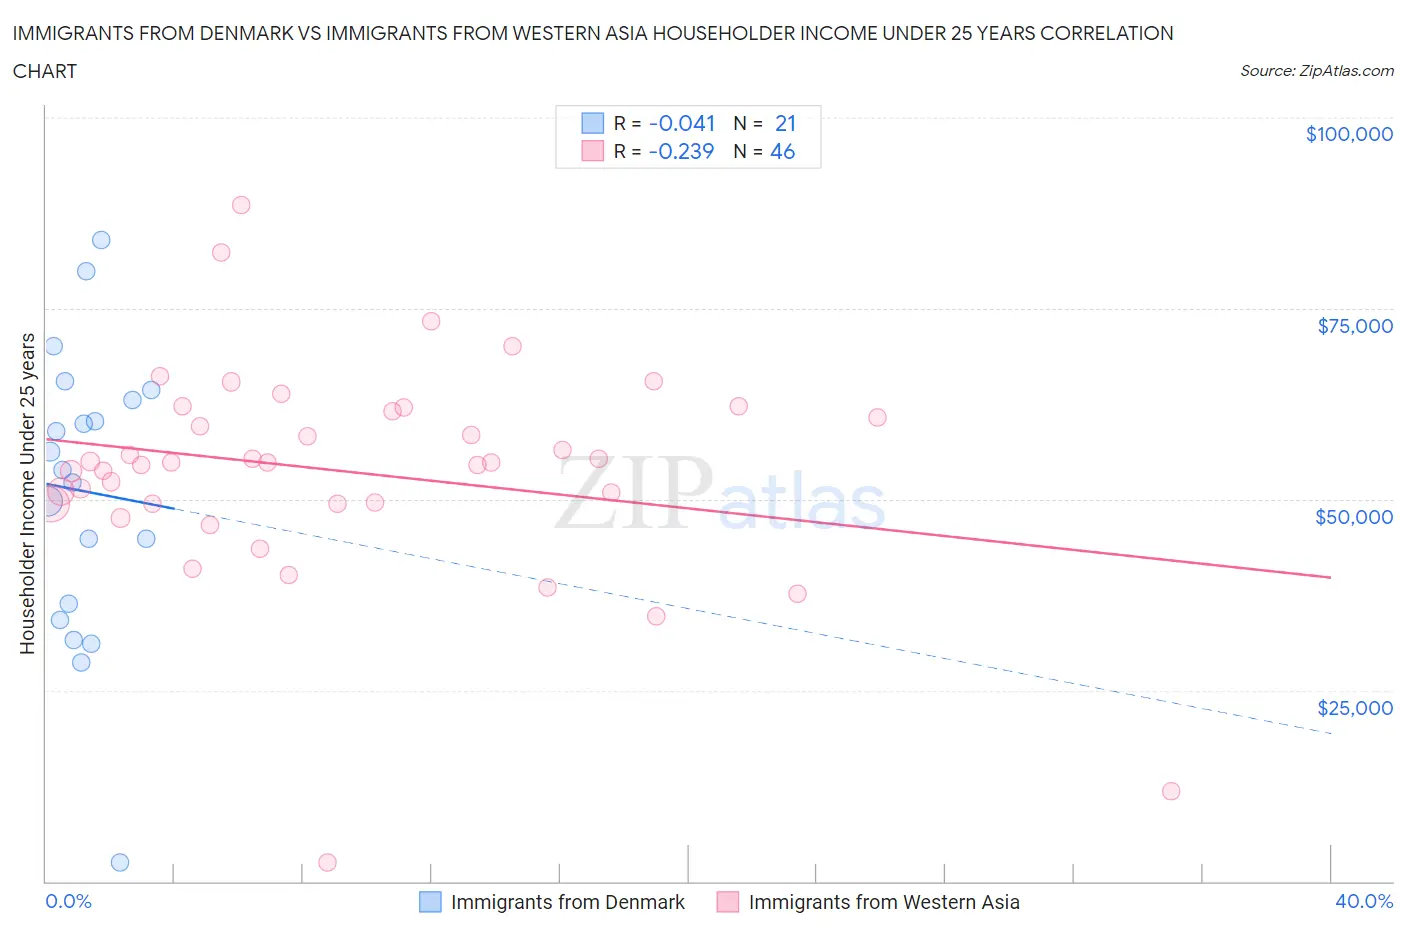
Immigrants from Denmark vs Immigrants from Western Asia Householder Income Under 25 years Correlation Chart
The statistical analysis conducted on geographies consisting of 123,999,951 people shows no correlation between the proportion of Immigrants from Denmark and household income with householder under the age of 25 in the United States with a correlation coefficient (R) of -0.041 and weighted average of $52,612. Similarly, the statistical analysis conducted on geographies consisting of 339,196,306 people shows a weak negative correlation between the proportion of Immigrants from Western Asia and household income with householder under the age of 25 in the United States with a correlation coefficient (R) of -0.239 and weighted average of $52,190, a difference of 0.81%.
Householder Income Under 25 years Correlation Summary
| Measurement | Immigrants from Denmark | Immigrants from Western Asia |
| Minimum | $2,499 | $2,499 |
| Maximum | $84,000 | $88,535 |
| Range | $81,501 | $86,036 |
| Mean | $51,040 | $53,619 |
| Median | $53,874 | $54,787 |
| Interquartile 25% (IQ1) | $35,276 | $49,428 |
| Interquartile 75% (IQ3) | $63,691 | $61,469 |
| Interquartile Range (IQR) | $28,415 | $12,041 |
| Standard Deviation (Sample) | $19,074 | $14,523 |
| Standard Deviation (Population) | $18,615 | $14,365 |
Demographics Similar to Immigrants from Denmark and Immigrants from Western Asia by Householder Income Under 25 years
In terms of householder income under 25 years, the demographic groups most similar to Immigrants from Denmark are Immigrants from Nepal ($52,611, a difference of 0.0%), Immigrants from the Azores ($52,621, a difference of 0.020%), Ghanaian ($52,594, a difference of 0.040%), Immigrants from Netherlands ($52,592, a difference of 0.040%), and Mongolian ($52,540, a difference of 0.14%). Similarly, the demographic groups most similar to Immigrants from Western Asia are Barbadian ($52,202, a difference of 0.020%), Cypriot ($52,209, a difference of 0.040%), Immigrants from Uruguay ($52,302, a difference of 0.21%), Canadian ($52,336, a difference of 0.28%), and Israeli ($52,335, a difference of 0.28%).
| Demographics | Rating | Rank | Householder Income Under 25 years |
| Immigrants | Azores | 74.2 /100 | #154 | Good $52,621 |
| Immigrants | Denmark | 73.8 /100 | #155 | Good $52,612 |
| Immigrants | Nepal | 73.7 /100 | #156 | Good $52,611 |
| Ghanaians | 72.9 /100 | #157 | Good $52,594 |
| Immigrants | Netherlands | 72.8 /100 | #158 | Good $52,592 |
| Mongolians | 70.2 /100 | #159 | Good $52,540 |
| Immigrants | Turkey | 68.3 /100 | #160 | Good $52,503 |
| Uruguayans | 66.2 /100 | #161 | Good $52,465 |
| Immigrants | Cambodia | 65.4 /100 | #162 | Good $52,450 |
| Immigrants | Chile | 64.8 /100 | #163 | Good $52,440 |
| Immigrants | Trinidad and Tobago | 64.7 /100 | #164 | Good $52,437 |
| Poles | 63.0 /100 | #165 | Good $52,407 |
| Immigrants | Austria | 62.6 /100 | #166 | Good $52,400 |
| Immigrants | Uganda | 61.1 /100 | #167 | Good $52,374 |
| Japanese | 60.5 /100 | #168 | Good $52,365 |
| Canadians | 58.8 /100 | #169 | Average $52,336 |
| Israelis | 58.8 /100 | #170 | Average $52,335 |
| Immigrants | Uruguay | 56.8 /100 | #171 | Average $52,302 |
| Cypriots | 51.2 /100 | #172 | Average $52,209 |
| Barbadians | 50.8 /100 | #173 | Average $52,202 |
| Immigrants | Western Asia | 50.0 /100 | #174 | Average $52,190 |