Immigrants from Denmark vs Immigrants from Western Asia College, 1 year or more
COMPARE
Immigrants from Denmark
Immigrants from Western Asia
College, 1 year or more
College, 1 year or more Comparison
Immigrants from Denmark
Immigrants from Western Asia
65.6%
COLLEGE, 1 YEAR OR MORE
100.0/ 100
METRIC RATING
30th/ 347
METRIC RANK
62.5%
COLLEGE, 1 YEAR OR MORE
97.9/ 100
METRIC RATING
90th/ 347
METRIC RANK
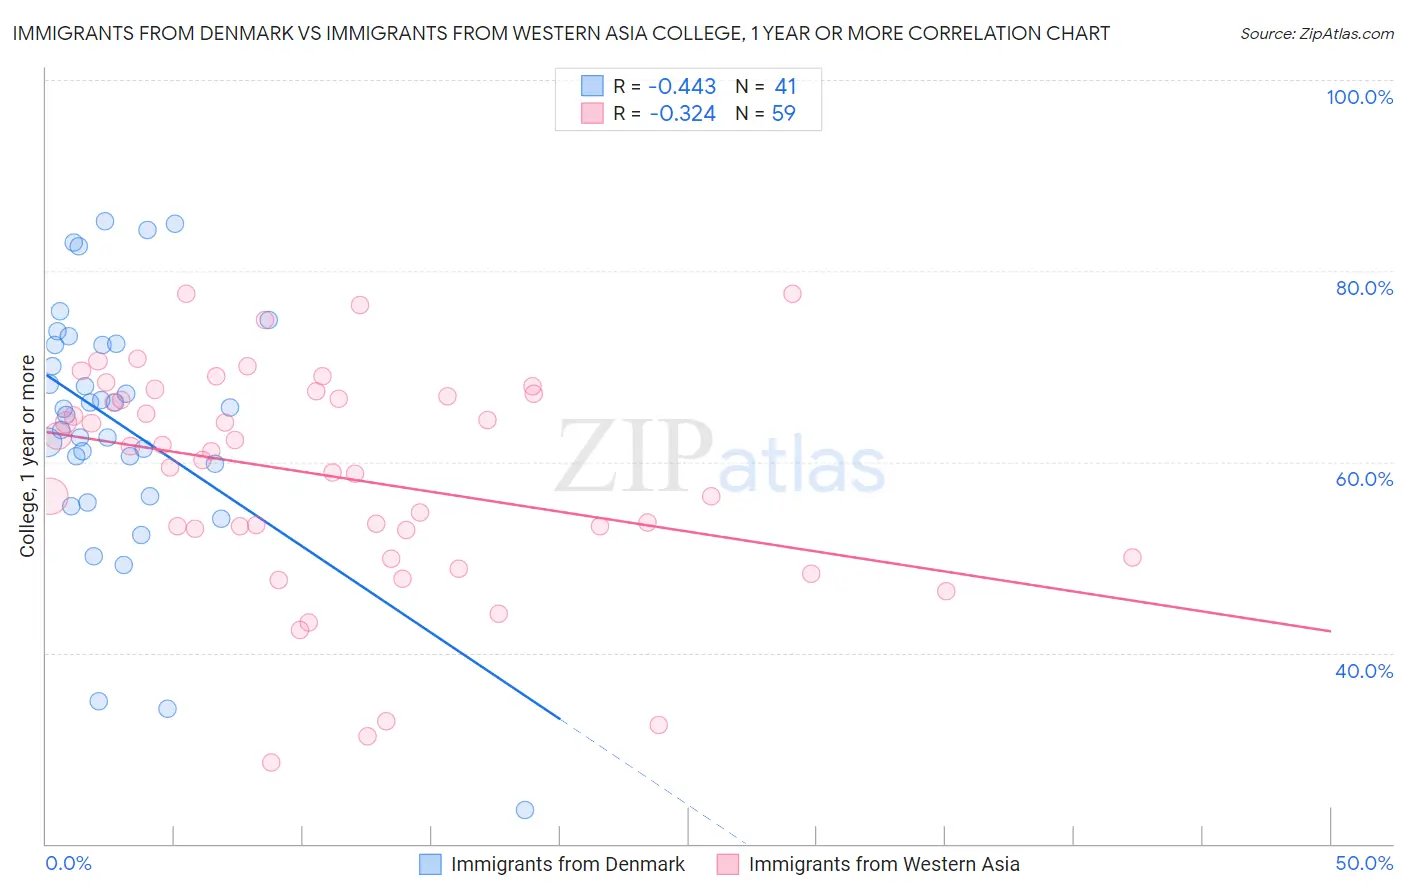
Immigrants from Denmark vs Immigrants from Western Asia College, 1 year or more Correlation Chart
The statistical analysis conducted on geographies consisting of 136,430,932 people shows a moderate negative correlation between the proportion of Immigrants from Denmark and percentage of population with at least college, 1 year or more education in the United States with a correlation coefficient (R) of -0.443 and weighted average of 65.6%. Similarly, the statistical analysis conducted on geographies consisting of 404,433,351 people shows a mild negative correlation between the proportion of Immigrants from Western Asia and percentage of population with at least college, 1 year or more education in the United States with a correlation coefficient (R) of -0.324 and weighted average of 62.5%, a difference of 5.0%.
College, 1 year or more Correlation Summary
| Measurement | Immigrants from Denmark | Immigrants from Western Asia |
| Minimum | 23.5% | 28.5% |
| Maximum | 85.2% | 77.6% |
| Range | 61.6% | 49.1% |
| Mean | 64.0% | 58.5% |
| Median | 65.5% | 61.2% |
| Interquartile 25% (IQ1) | 58.1% | 52.9% |
| Interquartile 75% (IQ3) | 72.3% | 67.1% |
| Interquartile Range (IQR) | 14.1% | 14.3% |
| Standard Deviation (Sample) | 13.3% | 11.5% |
| Standard Deviation (Population) | 13.1% | 11.4% |
Similar Demographics by College, 1 year or more
Demographics Similar to Immigrants from Denmark by College, 1 year or more
In terms of college, 1 year or more, the demographic groups most similar to Immigrants from Denmark are Turkish (65.5%, a difference of 0.080%), Immigrants from Northern Europe (65.6%, a difference of 0.11%), Bulgarian (65.5%, a difference of 0.13%), Immigrants from Sri Lanka (65.4%, a difference of 0.28%), and Immigrants from France (65.8%, a difference of 0.36%).
| Demographics | Rating | Rank | College, 1 year or more |
| Immigrants | China | 100.0 /100 | #23 | Exceptional 66.4% |
| Immigrants | Belgium | 100.0 /100 | #24 | Exceptional 66.3% |
| Indians (Asian) | 100.0 /100 | #25 | Exceptional 66.1% |
| Latvians | 100.0 /100 | #26 | Exceptional 66.1% |
| Immigrants | Ireland | 100.0 /100 | #27 | Exceptional 65.9% |
| Immigrants | France | 100.0 /100 | #28 | Exceptional 65.8% |
| Immigrants | Northern Europe | 100.0 /100 | #29 | Exceptional 65.6% |
| Immigrants | Denmark | 100.0 /100 | #30 | Exceptional 65.6% |
| Turks | 100.0 /100 | #31 | Exceptional 65.5% |
| Bulgarians | 100.0 /100 | #32 | Exceptional 65.5% |
| Immigrants | Sri Lanka | 99.9 /100 | #33 | Exceptional 65.4% |
| Israelis | 99.9 /100 | #34 | Exceptional 65.3% |
| Immigrants | Turkey | 99.9 /100 | #35 | Exceptional 65.2% |
| Immigrants | South Africa | 99.9 /100 | #36 | Exceptional 65.1% |
| Russians | 99.9 /100 | #37 | Exceptional 65.1% |
Demographics Similar to Immigrants from Western Asia by College, 1 year or more
In terms of college, 1 year or more, the demographic groups most similar to Immigrants from Western Asia are Immigrants from Eastern Europe (62.4%, a difference of 0.10%), Immigrants from Egypt (62.4%, a difference of 0.11%), Romanian (62.4%, a difference of 0.14%), Immigrants from Ethiopia (62.6%, a difference of 0.17%), and Immigrants from Croatia (62.3%, a difference of 0.20%).
| Demographics | Rating | Rank | College, 1 year or more |
| Immigrants | Argentina | 98.6 /100 | #83 | Exceptional 62.8% |
| Immigrants | England | 98.6 /100 | #84 | Exceptional 62.8% |
| Immigrants | Pakistan | 98.6 /100 | #85 | Exceptional 62.8% |
| Immigrants | Western Europe | 98.6 /100 | #86 | Exceptional 62.7% |
| Immigrants | Hungary | 98.6 /100 | #87 | Exceptional 62.7% |
| Greeks | 98.3 /100 | #88 | Exceptional 62.6% |
| Immigrants | Ethiopia | 98.2 /100 | #89 | Exceptional 62.6% |
| Immigrants | Western Asia | 97.9 /100 | #90 | Exceptional 62.5% |
| Immigrants | Eastern Europe | 97.8 /100 | #91 | Exceptional 62.4% |
| Immigrants | Egypt | 97.8 /100 | #92 | Exceptional 62.4% |
| Romanians | 97.7 /100 | #93 | Exceptional 62.4% |
| Immigrants | Croatia | 97.6 /100 | #94 | Exceptional 62.3% |
| British | 97.4 /100 | #95 | Exceptional 62.3% |
| Chinese | 97.2 /100 | #96 | Exceptional 62.2% |
| Jordanians | 97.2 /100 | #97 | Exceptional 62.2% |