Immigrants from Cuba vs Immigrants from Saudi Arabia No Vehicles in Household
COMPARE
Immigrants from Cuba
Immigrants from Saudi Arabia
No Vehicles in Household
No Vehicles in Household Comparison
Immigrants from Cuba
Immigrants from Saudi Arabia
8.7%
NO VEHICLES IN HOUSEHOLD
99.2/ 100
METRIC RATING
89th/ 347
METRIC RANK
10.3%
NO VEHICLES IN HOUSEHOLD
58.8/ 100
METRIC RATING
167th/ 347
METRIC RANK
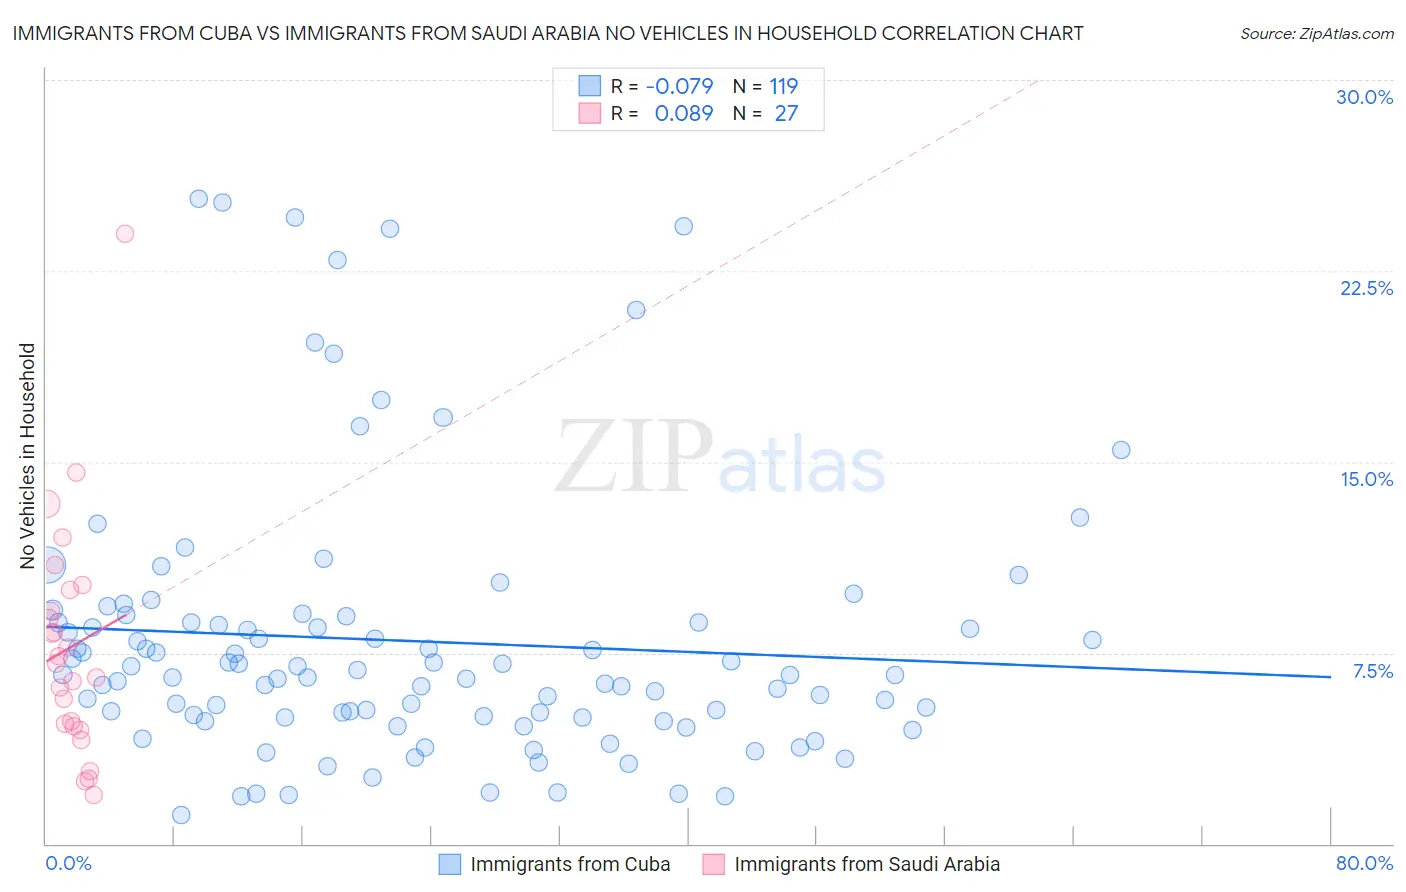
Immigrants from Cuba vs Immigrants from Saudi Arabia No Vehicles in Household Correlation Chart
The statistical analysis conducted on geographies consisting of 325,235,999 people shows a slight negative correlation between the proportion of Immigrants from Cuba and percentage of households with no vehicle available in the United States with a correlation coefficient (R) of -0.079 and weighted average of 8.7%. Similarly, the statistical analysis conducted on geographies consisting of 164,171,346 people shows a slight positive correlation between the proportion of Immigrants from Saudi Arabia and percentage of households with no vehicle available in the United States with a correlation coefficient (R) of 0.089 and weighted average of 10.3%, a difference of 18.1%.
No Vehicles in Household Correlation Summary
| Measurement | Immigrants from Cuba | Immigrants from Saudi Arabia |
| Minimum | 1.1% | 1.9% |
| Maximum | 25.3% | 24.0% |
| Range | 24.2% | 22.0% |
| Mean | 8.0% | 7.7% |
| Median | 6.6% | 7.1% |
| Interquartile 25% (IQ1) | 5.0% | 4.6% |
| Interquartile 75% (IQ3) | 8.7% | 10.0% |
| Interquartile Range (IQR) | 3.7% | 5.4% |
| Standard Deviation (Sample) | 5.3% | 4.6% |
| Standard Deviation (Population) | 5.3% | 4.6% |
Similar Demographics by No Vehicles in Household
Demographics Similar to Immigrants from Cuba by No Vehicles in Household
In terms of no vehicles in household, the demographic groups most similar to Immigrants from Cuba are Bhutanese (8.7%, a difference of 0.090%), Osage (8.7%, a difference of 0.14%), Immigrants from England (8.7%, a difference of 0.26%), Immigrants from Germany (8.7%, a difference of 0.28%), and Immigrants from Canada (8.7%, a difference of 0.30%).
| Demographics | Rating | Rank | No Vehicles in Household |
| Immigrants | South Eastern Asia | 99.4 /100 | #82 | Exceptional 8.6% |
| Italians | 99.4 /100 | #83 | Exceptional 8.6% |
| Immigrants | Jordan | 99.3 /100 | #84 | Exceptional 8.7% |
| Lebanese | 99.3 /100 | #85 | Exceptional 8.7% |
| Bangladeshis | 99.3 /100 | #86 | Exceptional 8.7% |
| Immigrants | England | 99.2 /100 | #87 | Exceptional 8.7% |
| Osage | 99.2 /100 | #88 | Exceptional 8.7% |
| Immigrants | Cuba | 99.2 /100 | #89 | Exceptional 8.7% |
| Bhutanese | 99.2 /100 | #90 | Exceptional 8.7% |
| Immigrants | Germany | 99.1 /100 | #91 | Exceptional 8.7% |
| Immigrants | Canada | 99.1 /100 | #92 | Exceptional 8.7% |
| Immigrants | North America | 99.1 /100 | #93 | Exceptional 8.7% |
| Austrians | 98.9 /100 | #94 | Exceptional 8.8% |
| Potawatomi | 98.8 /100 | #95 | Exceptional 8.8% |
| Immigrants | Bolivia | 98.7 /100 | #96 | Exceptional 8.9% |
Demographics Similar to Immigrants from Saudi Arabia by No Vehicles in Household
In terms of no vehicles in household, the demographic groups most similar to Immigrants from Saudi Arabia are Immigrants from Costa Rica (10.3%, a difference of 0.24%), Indonesian (10.3%, a difference of 0.29%), Comanche (10.2%, a difference of 0.30%), South African (10.2%, a difference of 0.34%), and Lumbee (10.3%, a difference of 0.56%).
| Demographics | Rating | Rank | No Vehicles in Household |
| Immigrants | Middle Africa | 65.7 /100 | #160 | Good 10.2% |
| New Zealanders | 65.1 /100 | #161 | Good 10.2% |
| Immigrants | Austria | 64.4 /100 | #162 | Good 10.2% |
| Immigrants | Cambodia | 63.7 /100 | #163 | Good 10.2% |
| South Africans | 61.1 /100 | #164 | Good 10.2% |
| Comanche | 60.8 /100 | #165 | Good 10.2% |
| Immigrants | Costa Rica | 60.5 /100 | #166 | Good 10.3% |
| Immigrants | Saudi Arabia | 58.8 /100 | #167 | Average 10.3% |
| Indonesians | 56.7 /100 | #168 | Average 10.3% |
| Lumbee | 54.7 /100 | #169 | Average 10.3% |
| Immigrants | Latin America | 53.2 /100 | #170 | Average 10.4% |
| Hmong | 52.7 /100 | #171 | Average 10.4% |
| Brazilians | 51.7 /100 | #172 | Average 10.4% |
| Filipinos | 50.1 /100 | #173 | Average 10.4% |
| Immigrants | Sudan | 50.0 /100 | #174 | Average 10.4% |