Immigrants from Caribbean vs Tongan 4 or more Vehicles in Household
COMPARE
Immigrants from Caribbean
Tongan
4 or more Vehicles in Household
4 or more Vehicles in Household Comparison
Immigrants from Caribbean
Tongans
4.4%
4 OR MORE VEHICLES IN HOUSEHOLD
0.0/ 100
METRIC RATING
323rd/ 347
METRIC RANK
10.0%
4 OR MORE VEHICLES IN HOUSEHOLD
100.0/ 100
METRIC RATING
4th/ 347
METRIC RANK
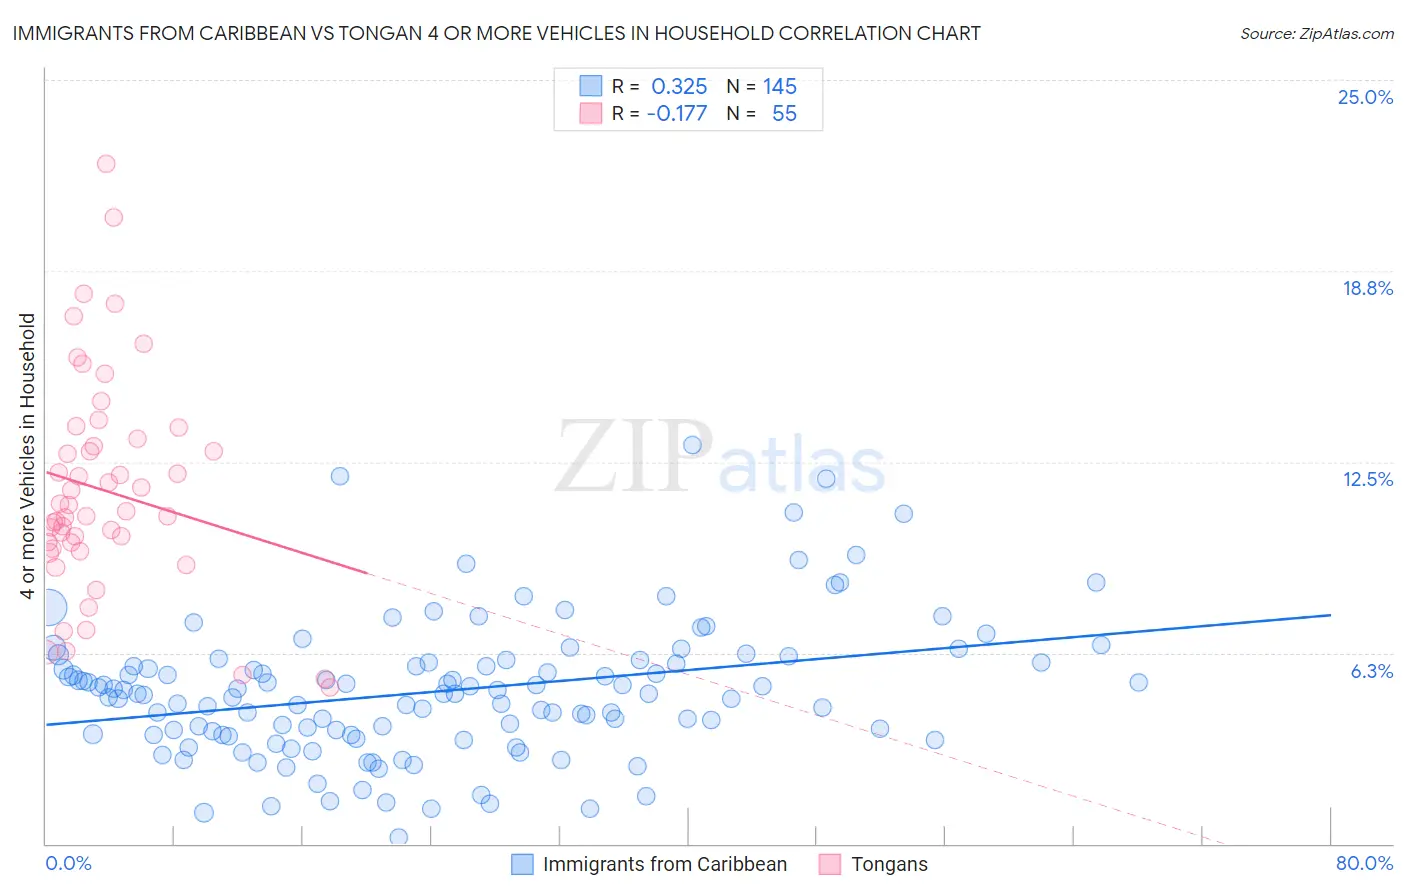
Immigrants from Caribbean vs Tongan 4 or more Vehicles in Household Correlation Chart
The statistical analysis conducted on geographies consisting of 447,619,354 people shows a mild positive correlation between the proportion of Immigrants from Caribbean and percentage of households with 4 or more vehicles available in the United States with a correlation coefficient (R) of 0.325 and weighted average of 4.4%. Similarly, the statistical analysis conducted on geographies consisting of 102,814,982 people shows a poor negative correlation between the proportion of Tongans and percentage of households with 4 or more vehicles available in the United States with a correlation coefficient (R) of -0.177 and weighted average of 10.0%, a difference of 126.2%.
4 or more Vehicles in Household Correlation Summary
| Measurement | Immigrants from Caribbean | Tongan |
| Minimum | 0.20% | 5.1% |
| Maximum | 13.0% | 22.3% |
| Range | 12.8% | 17.1% |
| Mean | 5.0% | 11.6% |
| Median | 4.9% | 10.9% |
| Interquartile 25% (IQ1) | 3.6% | 9.7% |
| Interquartile 75% (IQ3) | 5.9% | 13.3% |
| Interquartile Range (IQR) | 2.4% | 3.6% |
| Standard Deviation (Sample) | 2.2% | 3.6% |
| Standard Deviation (Population) | 2.2% | 3.6% |
Similar Demographics by 4 or more Vehicles in Household
Demographics Similar to Immigrants from Caribbean by 4 or more Vehicles in Household
In terms of 4 or more vehicles in household, the demographic groups most similar to Immigrants from Caribbean are Soviet Union (4.4%, a difference of 0.28%), Immigrants from Yemen (4.5%, a difference of 0.40%), Ecuadorian (4.5%, a difference of 0.58%), Immigrants from Jamaica (4.4%, a difference of 0.60%), and Cape Verdean (4.4%, a difference of 0.92%).
| Demographics | Rating | Rank | 4 or more Vehicles in Household |
| Puerto Ricans | 0.0 /100 | #316 | Tragic 4.7% |
| U.S. Virgin Islanders | 0.0 /100 | #317 | Tragic 4.6% |
| Jamaicans | 0.0 /100 | #318 | Tragic 4.6% |
| Haitians | 0.0 /100 | #319 | Tragic 4.6% |
| Immigrants | Haiti | 0.0 /100 | #320 | Tragic 4.5% |
| Ecuadorians | 0.0 /100 | #321 | Tragic 4.5% |
| Immigrants | Yemen | 0.0 /100 | #322 | Tragic 4.5% |
| Immigrants | Caribbean | 0.0 /100 | #323 | Tragic 4.4% |
| Soviet Union | 0.0 /100 | #324 | Tragic 4.4% |
| Immigrants | Jamaica | 0.0 /100 | #325 | Tragic 4.4% |
| Cape Verdeans | 0.0 /100 | #326 | Tragic 4.4% |
| Senegalese | 0.0 /100 | #327 | Tragic 4.3% |
| Trinidadians and Tobagonians | 0.0 /100 | #328 | Tragic 4.3% |
| Immigrants | Senegal | 0.0 /100 | #329 | Tragic 4.2% |
| Immigrants | Ecuador | 0.0 /100 | #330 | Tragic 4.2% |
Demographics Similar to Tongans by 4 or more Vehicles in Household
In terms of 4 or more vehicles in household, the demographic groups most similar to Tongans are Immigrants from Fiji (9.6%, a difference of 4.3%), Puget Sound Salish (9.4%, a difference of 6.9%), Native Hawaiian (9.4%, a difference of 6.9%), Spanish American Indian (10.8%, a difference of 7.3%), and Arapaho (9.4%, a difference of 7.3%).
| Demographics | Rating | Rank | 4 or more Vehicles in Household |
| Yakama | 100 /100 | #1 | Exceptional 12.9% |
| Colville | 100.0 /100 | #2 | Exceptional 11.1% |
| Spanish American Indians | 100.0 /100 | #3 | Exceptional 10.8% |
| Tongans | 100.0 /100 | #4 | Exceptional 10.0% |
| Immigrants | Fiji | 100.0 /100 | #5 | Exceptional 9.6% |
| Puget Sound Salish | 100.0 /100 | #6 | Exceptional 9.4% |
| Native Hawaiians | 100.0 /100 | #7 | Exceptional 9.4% |
| Arapaho | 100.0 /100 | #8 | Exceptional 9.4% |
| Samoans | 100.0 /100 | #9 | Exceptional 9.2% |
| Paiute | 100.0 /100 | #10 | Exceptional 9.0% |
| Immigrants | Mexico | 100.0 /100 | #11 | Exceptional 9.0% |
| Mexicans | 100.0 /100 | #12 | Exceptional 8.9% |
| Hawaiians | 100.0 /100 | #13 | Exceptional 8.9% |
| Chinese | 100.0 /100 | #14 | Exceptional 8.8% |
| Shoshone | 100.0 /100 | #15 | Exceptional 8.8% |