Sioux vs Tongan 4 or more Vehicles in Household
COMPARE
Sioux
Tongan
4 or more Vehicles in Household
4 or more Vehicles in Household Comparison
Sioux
Tongans
8.0%
4 OR MORE VEHICLES IN HOUSEHOLD
100.0/ 100
METRIC RATING
38th/ 347
METRIC RANK
10.0%
4 OR MORE VEHICLES IN HOUSEHOLD
100.0/ 100
METRIC RATING
4th/ 347
METRIC RANK
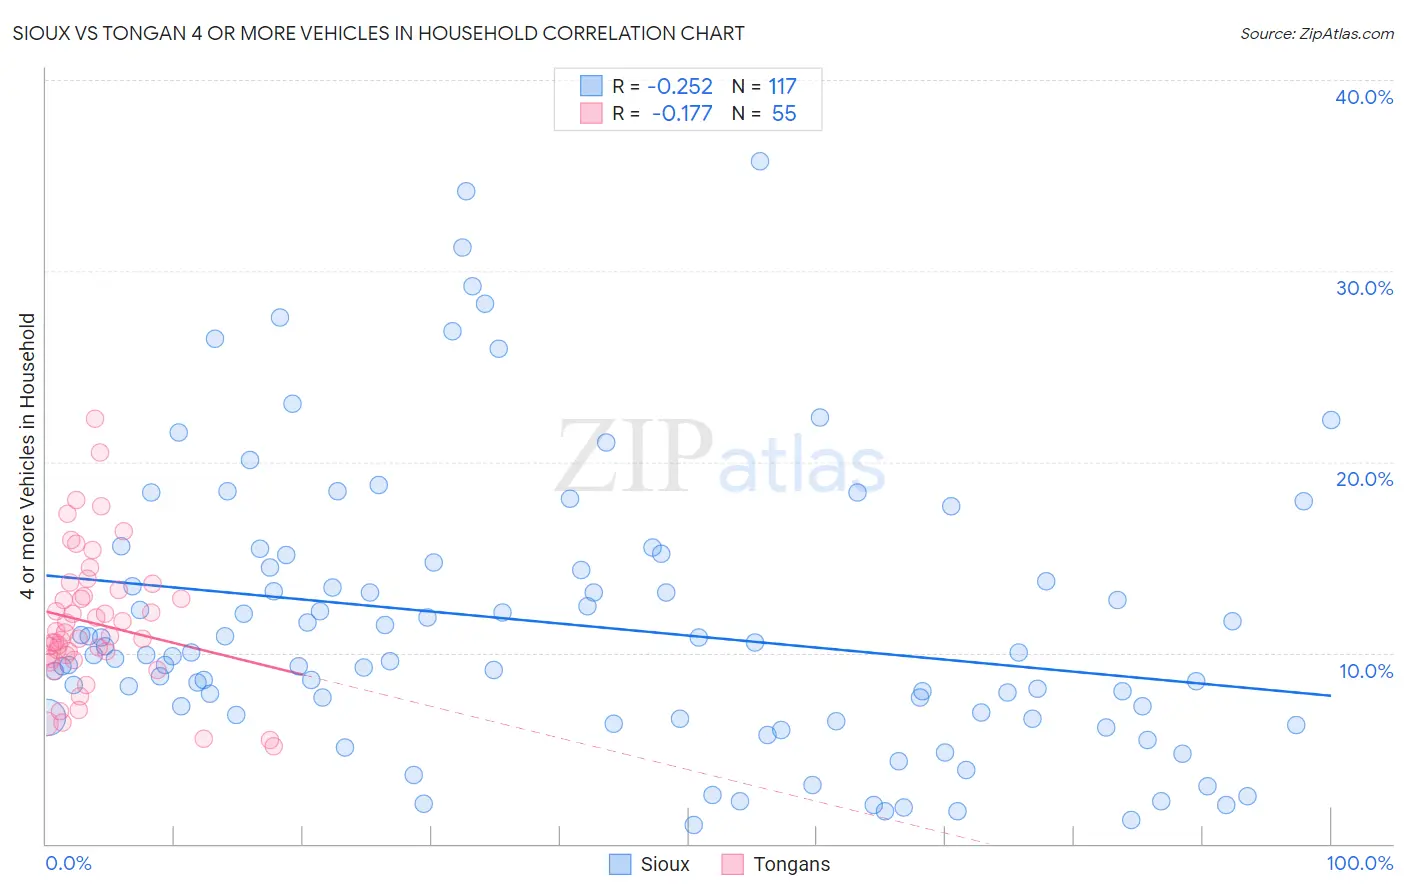
Sioux vs Tongan 4 or more Vehicles in Household Correlation Chart
The statistical analysis conducted on geographies consisting of 233,666,297 people shows a weak negative correlation between the proportion of Sioux and percentage of households with 4 or more vehicles available in the United States with a correlation coefficient (R) of -0.252 and weighted average of 8.0%. Similarly, the statistical analysis conducted on geographies consisting of 102,814,982 people shows a poor negative correlation between the proportion of Tongans and percentage of households with 4 or more vehicles available in the United States with a correlation coefficient (R) of -0.177 and weighted average of 10.0%, a difference of 25.8%.
4 or more Vehicles in Household Correlation Summary
| Measurement | Sioux | Tongan |
| Minimum | 0.99% | 5.1% |
| Maximum | 35.7% | 22.3% |
| Range | 34.7% | 17.1% |
| Mean | 11.5% | 11.6% |
| Median | 9.9% | 10.9% |
| Interquartile 25% (IQ1) | 6.6% | 9.7% |
| Interquartile 75% (IQ3) | 14.6% | 13.3% |
| Interquartile Range (IQR) | 8.0% | 3.6% |
| Standard Deviation (Sample) | 7.4% | 3.6% |
| Standard Deviation (Population) | 7.3% | 3.6% |
Similar Demographics by 4 or more Vehicles in Household
Demographics Similar to Sioux by 4 or more Vehicles in Household
In terms of 4 or more vehicles in household, the demographic groups most similar to Sioux are Scandinavian (8.0%, a difference of 0.030%), Norwegian (8.0%, a difference of 0.20%), Spanish American (8.0%, a difference of 0.22%), Spanish (7.9%, a difference of 0.86%), and Guamanian/Chamorro (8.1%, a difference of 0.99%).
| Demographics | Rating | Rank | 4 or more Vehicles in Household |
| Natives/Alaskans | 100.0 /100 | #31 | Exceptional 8.2% |
| Marshallese | 100.0 /100 | #32 | Exceptional 8.1% |
| Yaqui | 100.0 /100 | #33 | Exceptional 8.1% |
| Alaskan Athabascans | 100.0 /100 | #34 | Exceptional 8.1% |
| Guamanians/Chamorros | 100.0 /100 | #35 | Exceptional 8.1% |
| Norwegians | 100.0 /100 | #36 | Exceptional 8.0% |
| Scandinavians | 100.0 /100 | #37 | Exceptional 8.0% |
| Sioux | 100.0 /100 | #38 | Exceptional 8.0% |
| Spanish Americans | 100.0 /100 | #39 | Exceptional 8.0% |
| Spanish | 100.0 /100 | #40 | Exceptional 7.9% |
| Pima | 100.0 /100 | #41 | Exceptional 7.9% |
| Salvadorans | 100.0 /100 | #42 | Exceptional 7.8% |
| Fijians | 100.0 /100 | #43 | Exceptional 7.8% |
| Bhutanese | 100.0 /100 | #44 | Exceptional 7.8% |
| Choctaw | 100.0 /100 | #45 | Exceptional 7.8% |
Demographics Similar to Tongans by 4 or more Vehicles in Household
In terms of 4 or more vehicles in household, the demographic groups most similar to Tongans are Immigrants from Fiji (9.6%, a difference of 4.3%), Puget Sound Salish (9.4%, a difference of 6.9%), Native Hawaiian (9.4%, a difference of 6.9%), Spanish American Indian (10.8%, a difference of 7.3%), and Arapaho (9.4%, a difference of 7.3%).
| Demographics | Rating | Rank | 4 or more Vehicles in Household |
| Yakama | 100 /100 | #1 | Exceptional 12.9% |
| Colville | 100.0 /100 | #2 | Exceptional 11.1% |
| Spanish American Indians | 100.0 /100 | #3 | Exceptional 10.8% |
| Tongans | 100.0 /100 | #4 | Exceptional 10.0% |
| Immigrants | Fiji | 100.0 /100 | #5 | Exceptional 9.6% |
| Puget Sound Salish | 100.0 /100 | #6 | Exceptional 9.4% |
| Native Hawaiians | 100.0 /100 | #7 | Exceptional 9.4% |
| Arapaho | 100.0 /100 | #8 | Exceptional 9.4% |
| Samoans | 100.0 /100 | #9 | Exceptional 9.2% |
| Paiute | 100.0 /100 | #10 | Exceptional 9.0% |
| Immigrants | Mexico | 100.0 /100 | #11 | Exceptional 9.0% |
| Mexicans | 100.0 /100 | #12 | Exceptional 8.9% |
| Hawaiians | 100.0 /100 | #13 | Exceptional 8.9% |
| Chinese | 100.0 /100 | #14 | Exceptional 8.8% |
| Shoshone | 100.0 /100 | #15 | Exceptional 8.8% |