Immigrants from Caribbean vs Tongan Doctorate Degree
COMPARE
Immigrants from Caribbean
Tongan
Doctorate Degree
Doctorate Degree Comparison
Immigrants from Caribbean
Tongans
1.3%
DOCTORATE DEGREE
0.0/ 100
METRIC RATING
333rd/ 347
METRIC RANK
1.7%
DOCTORATE DEGREE
15.1/ 100
METRIC RATING
210th/ 347
METRIC RANK
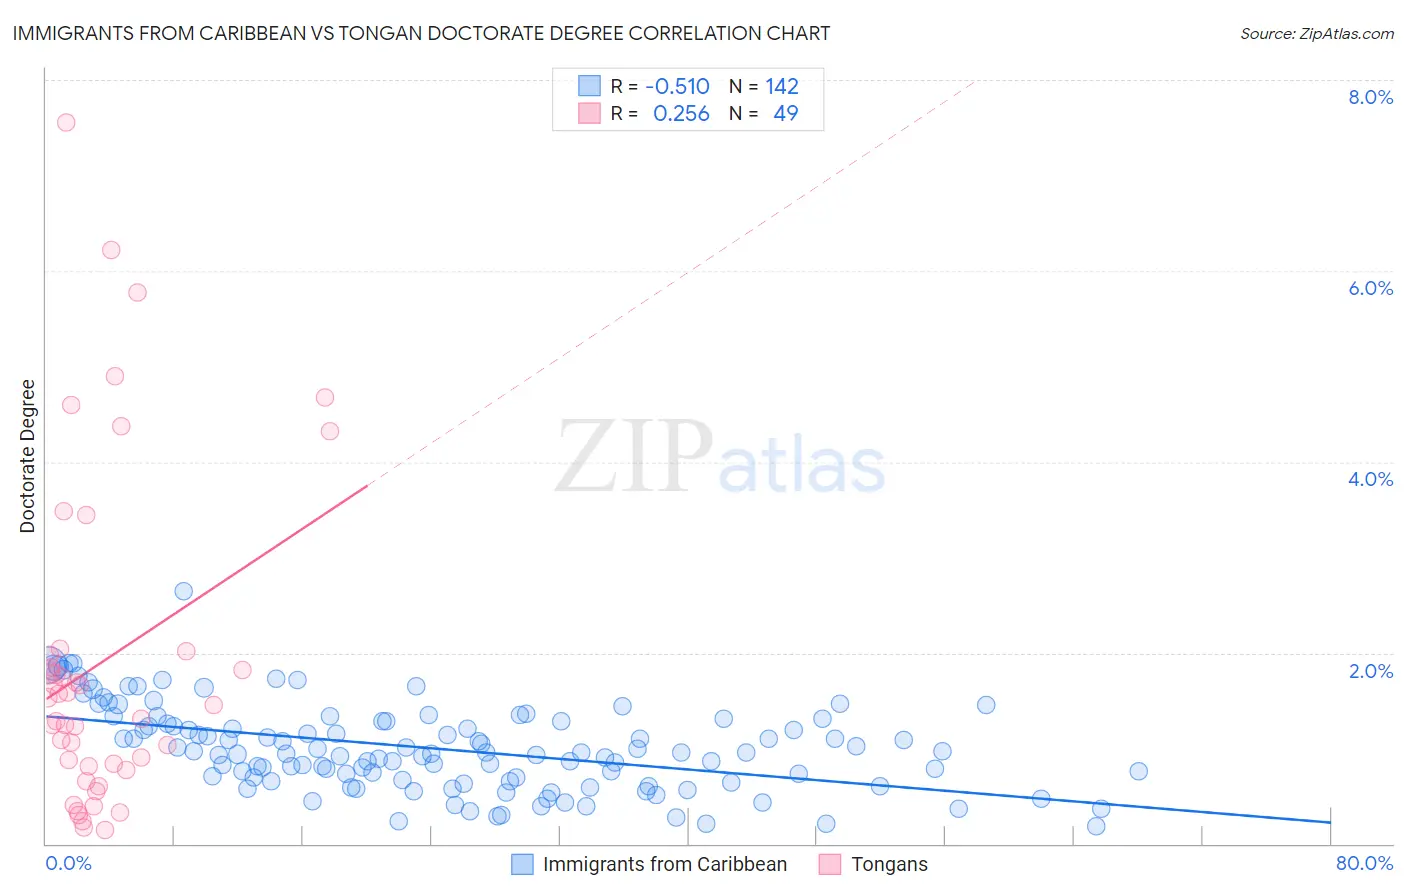
Immigrants from Caribbean vs Tongan Doctorate Degree Correlation Chart
The statistical analysis conducted on geographies consisting of 443,887,060 people shows a substantial negative correlation between the proportion of Immigrants from Caribbean and percentage of population with at least doctorate degree education in the United States with a correlation coefficient (R) of -0.510 and weighted average of 1.3%. Similarly, the statistical analysis conducted on geographies consisting of 102,428,868 people shows a weak positive correlation between the proportion of Tongans and percentage of population with at least doctorate degree education in the United States with a correlation coefficient (R) of 0.256 and weighted average of 1.7%, a difference of 34.5%.
Doctorate Degree Correlation Summary
| Measurement | Immigrants from Caribbean | Tongan |
| Minimum | 0.18% | 0.15% |
| Maximum | 2.6% | 7.5% |
| Range | 2.5% | 7.4% |
| Mean | 1.00% | 1.9% |
| Median | 0.96% | 1.4% |
| Interquartile 25% (IQ1) | 0.67% | 0.79% |
| Interquartile 75% (IQ3) | 1.3% | 2.0% |
| Interquartile Range (IQR) | 0.61% | 1.2% |
| Standard Deviation (Sample) | 0.44% | 1.7% |
| Standard Deviation (Population) | 0.44% | 1.7% |
Similar Demographics by Doctorate Degree
Demographics Similar to Immigrants from Caribbean by Doctorate Degree
In terms of doctorate degree, the demographic groups most similar to Immigrants from Caribbean are Yakama (1.3%, a difference of 0.16%), Immigrants from Dominican Republic (1.3%, a difference of 0.19%), Immigrants from Latin America (1.3%, a difference of 1.7%), Yup'ik (1.3%, a difference of 1.8%), and Haitian (1.3%, a difference of 2.0%).
| Demographics | Rating | Rank | Doctorate Degree |
| Immigrants | Cabo Verde | 0.0 /100 | #326 | Tragic 1.3% |
| Hispanics or Latinos | 0.0 /100 | #327 | Tragic 1.3% |
| Inupiat | 0.0 /100 | #328 | Tragic 1.3% |
| Haitians | 0.0 /100 | #329 | Tragic 1.3% |
| Yup'ik | 0.0 /100 | #330 | Tragic 1.3% |
| Immigrants | Latin America | 0.0 /100 | #331 | Tragic 1.3% |
| Yakama | 0.0 /100 | #332 | Tragic 1.3% |
| Immigrants | Caribbean | 0.0 /100 | #333 | Tragic 1.3% |
| Immigrants | Dominican Republic | 0.0 /100 | #334 | Tragic 1.3% |
| Immigrants | Haiti | 0.0 /100 | #335 | Tragic 1.3% |
| Nepalese | 0.0 /100 | #336 | Tragic 1.3% |
| Bangladeshis | 0.0 /100 | #337 | Tragic 1.2% |
| Puget Sound Salish | 0.0 /100 | #338 | Tragic 1.2% |
| Immigrants | Central America | 0.0 /100 | #339 | Tragic 1.2% |
| Immigrants | Cuba | 0.0 /100 | #340 | Tragic 1.2% |
Demographics Similar to Tongans by Doctorate Degree
In terms of doctorate degree, the demographic groups most similar to Tongans are Immigrants from Armenia (1.7%, a difference of 0.010%), Immigrants from Western Africa (1.7%, a difference of 0.080%), Immigrants from South Eastern Asia (1.7%, a difference of 0.14%), Colombian (1.7%, a difference of 0.27%), and Korean (1.7%, a difference of 0.29%).
| Demographics | Rating | Rank | Doctorate Degree |
| Immigrants | Vietnam | 21.4 /100 | #203 | Fair 1.8% |
| Somalis | 21.2 /100 | #204 | Fair 1.7% |
| Venezuelans | 19.5 /100 | #205 | Poor 1.7% |
| Immigrants | Peru | 17.6 /100 | #206 | Poor 1.7% |
| Yugoslavians | 17.1 /100 | #207 | Poor 1.7% |
| Colombians | 16.1 /100 | #208 | Poor 1.7% |
| Immigrants | Western Africa | 15.4 /100 | #209 | Poor 1.7% |
| Tongans | 15.1 /100 | #210 | Poor 1.7% |
| Immigrants | Armenia | 15.1 /100 | #211 | Poor 1.7% |
| Immigrants | South Eastern Asia | 14.7 /100 | #212 | Poor 1.7% |
| Koreans | 14.2 /100 | #213 | Poor 1.7% |
| Pueblo | 14.2 /100 | #214 | Poor 1.7% |
| Alaskan Athabascans | 13.8 /100 | #215 | Poor 1.7% |
| Immigrants | Burma/Myanmar | 13.5 /100 | #216 | Poor 1.7% |
| Spanish Americans | 12.9 /100 | #217 | Poor 1.7% |