Immigrants from Caribbean vs European 4 or more Vehicles in Household
COMPARE
Immigrants from Caribbean
European
4 or more Vehicles in Household
4 or more Vehicles in Household Comparison
Immigrants from Caribbean
Europeans
4.4%
4 OR MORE VEHICLES IN HOUSEHOLD
0.0/ 100
METRIC RATING
323rd/ 347
METRIC RANK
7.6%
4 OR MORE VEHICLES IN HOUSEHOLD
100.0/ 100
METRIC RATING
61st/ 347
METRIC RANK
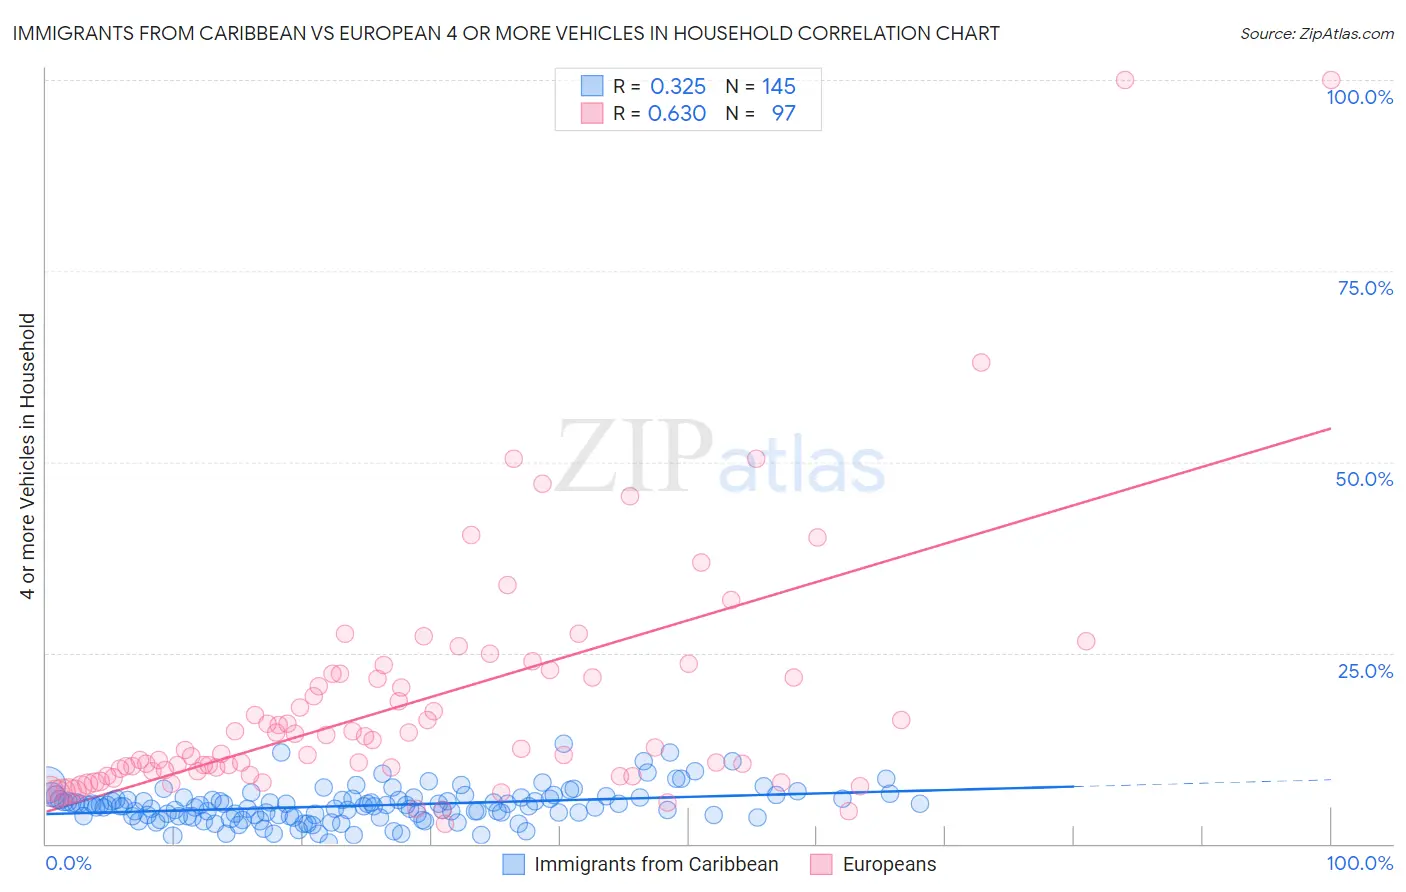
Immigrants from Caribbean vs European 4 or more Vehicles in Household Correlation Chart
The statistical analysis conducted on geographies consisting of 447,619,354 people shows a mild positive correlation between the proportion of Immigrants from Caribbean and percentage of households with 4 or more vehicles available in the United States with a correlation coefficient (R) of 0.325 and weighted average of 4.4%. Similarly, the statistical analysis conducted on geographies consisting of 558,591,930 people shows a significant positive correlation between the proportion of Europeans and percentage of households with 4 or more vehicles available in the United States with a correlation coefficient (R) of 0.630 and weighted average of 7.6%, a difference of 71.0%.
4 or more Vehicles in Household Correlation Summary
| Measurement | Immigrants from Caribbean | European |
| Minimum | 0.20% | 2.6% |
| Maximum | 13.0% | 100.0% |
| Range | 12.8% | 97.4% |
| Mean | 5.0% | 18.3% |
| Median | 4.9% | 12.5% |
| Interquartile 25% (IQ1) | 3.6% | 9.2% |
| Interquartile 75% (IQ3) | 5.9% | 22.0% |
| Interquartile Range (IQR) | 2.4% | 12.8% |
| Standard Deviation (Sample) | 2.2% | 16.5% |
| Standard Deviation (Population) | 2.2% | 16.4% |
Similar Demographics by 4 or more Vehicles in Household
Demographics Similar to Immigrants from Caribbean by 4 or more Vehicles in Household
In terms of 4 or more vehicles in household, the demographic groups most similar to Immigrants from Caribbean are Soviet Union (4.4%, a difference of 0.28%), Immigrants from Yemen (4.5%, a difference of 0.40%), Ecuadorian (4.5%, a difference of 0.58%), Immigrants from Jamaica (4.4%, a difference of 0.60%), and Cape Verdean (4.4%, a difference of 0.92%).
| Demographics | Rating | Rank | 4 or more Vehicles in Household |
| Puerto Ricans | 0.0 /100 | #316 | Tragic 4.7% |
| U.S. Virgin Islanders | 0.0 /100 | #317 | Tragic 4.6% |
| Jamaicans | 0.0 /100 | #318 | Tragic 4.6% |
| Haitians | 0.0 /100 | #319 | Tragic 4.6% |
| Immigrants | Haiti | 0.0 /100 | #320 | Tragic 4.5% |
| Ecuadorians | 0.0 /100 | #321 | Tragic 4.5% |
| Immigrants | Yemen | 0.0 /100 | #322 | Tragic 4.5% |
| Immigrants | Caribbean | 0.0 /100 | #323 | Tragic 4.4% |
| Soviet Union | 0.0 /100 | #324 | Tragic 4.4% |
| Immigrants | Jamaica | 0.0 /100 | #325 | Tragic 4.4% |
| Cape Verdeans | 0.0 /100 | #326 | Tragic 4.4% |
| Senegalese | 0.0 /100 | #327 | Tragic 4.3% |
| Trinidadians and Tobagonians | 0.0 /100 | #328 | Tragic 4.3% |
| Immigrants | Senegal | 0.0 /100 | #329 | Tragic 4.2% |
| Immigrants | Ecuador | 0.0 /100 | #330 | Tragic 4.2% |
Demographics Similar to Europeans by 4 or more Vehicles in Household
In terms of 4 or more vehicles in household, the demographic groups most similar to Europeans are Spaniard (7.6%, a difference of 0.26%), Chippewa (7.6%, a difference of 0.26%), Immigrants from Micronesia (7.6%, a difference of 0.27%), Hispanic or Latino (7.6%, a difference of 0.32%), and Pennsylvania German (7.6%, a difference of 0.36%).
| Demographics | Rating | Rank | 4 or more Vehicles in Household |
| Dutch | 100.0 /100 | #54 | Exceptional 7.7% |
| Immigrants | Oceania | 100.0 /100 | #55 | Exceptional 7.6% |
| English | 100.0 /100 | #56 | Exceptional 7.6% |
| Pennsylvania Germans | 100.0 /100 | #57 | Exceptional 7.6% |
| Swedes | 100.0 /100 | #58 | Exceptional 7.6% |
| Hispanics or Latinos | 100.0 /100 | #59 | Exceptional 7.6% |
| Spaniards | 100.0 /100 | #60 | Exceptional 7.6% |
| Europeans | 100.0 /100 | #61 | Exceptional 7.6% |
| Chippewa | 100.0 /100 | #62 | Exceptional 7.6% |
| Immigrants | Micronesia | 100.0 /100 | #63 | Exceptional 7.6% |
| Bangladeshis | 100.0 /100 | #64 | Exceptional 7.6% |
| Immigrants | Azores | 100.0 /100 | #65 | Exceptional 7.5% |
| Immigrants | Taiwan | 99.9 /100 | #66 | Exceptional 7.5% |
| Americans | 99.9 /100 | #67 | Exceptional 7.5% |
| Welsh | 99.9 /100 | #68 | Exceptional 7.5% |