Jordanian vs European 4 or more Vehicles in Household
COMPARE
Jordanian
European
4 or more Vehicles in Household
4 or more Vehicles in Household Comparison
Jordanians
Europeans
6.6%
4 OR MORE VEHICLES IN HOUSEHOLD
82.1/ 100
METRIC RATING
139th/ 347
METRIC RANK
7.6%
4 OR MORE VEHICLES IN HOUSEHOLD
100.0/ 100
METRIC RATING
61st/ 347
METRIC RANK
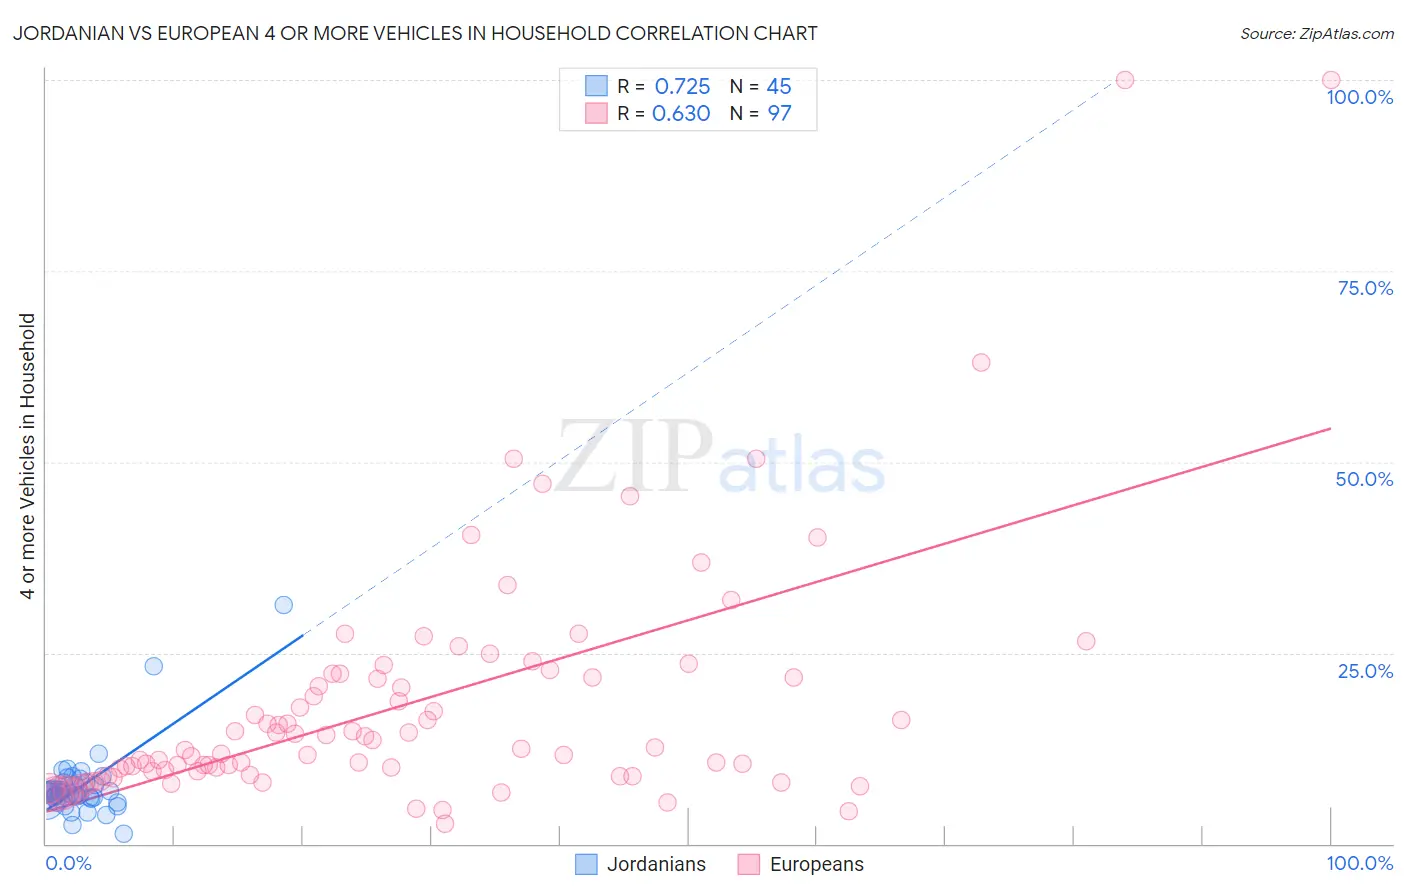
Jordanian vs European 4 or more Vehicles in Household Correlation Chart
The statistical analysis conducted on geographies consisting of 166,057,251 people shows a strong positive correlation between the proportion of Jordanians and percentage of households with 4 or more vehicles available in the United States with a correlation coefficient (R) of 0.725 and weighted average of 6.6%. Similarly, the statistical analysis conducted on geographies consisting of 558,591,930 people shows a significant positive correlation between the proportion of Europeans and percentage of households with 4 or more vehicles available in the United States with a correlation coefficient (R) of 0.630 and weighted average of 7.6%, a difference of 15.5%.
4 or more Vehicles in Household Correlation Summary
| Measurement | Jordanian | European |
| Minimum | 1.3% | 2.6% |
| Maximum | 31.2% | 100.0% |
| Range | 30.0% | 97.4% |
| Mean | 7.6% | 18.3% |
| Median | 6.7% | 12.5% |
| Interquartile 25% (IQ1) | 5.9% | 9.2% |
| Interquartile 75% (IQ3) | 8.0% | 22.0% |
| Interquartile Range (IQR) | 2.1% | 12.8% |
| Standard Deviation (Sample) | 4.8% | 16.5% |
| Standard Deviation (Population) | 4.7% | 16.4% |
Similar Demographics by 4 or more Vehicles in Household
Demographics Similar to Jordanians by 4 or more Vehicles in Household
In terms of 4 or more vehicles in household, the demographic groups most similar to Jordanians are Slavic (6.6%, a difference of 0.080%), Australian (6.6%, a difference of 0.21%), Immigrants from Iraq (6.5%, a difference of 0.41%), Italian (6.6%, a difference of 0.43%), and Immigrants from Canada (6.5%, a difference of 0.54%).
| Demographics | Rating | Rank | 4 or more Vehicles in Household |
| Immigrants | Netherlands | 87.8 /100 | #132 | Excellent 6.6% |
| Armenians | 86.9 /100 | #133 | Excellent 6.6% |
| Ottawa | 86.9 /100 | #134 | Excellent 6.6% |
| Tohono O'odham | 86.7 /100 | #135 | Excellent 6.6% |
| Luxembourgers | 86.4 /100 | #136 | Excellent 6.6% |
| French Canadians | 85.4 /100 | #137 | Excellent 6.6% |
| Italians | 84.5 /100 | #138 | Excellent 6.6% |
| Jordanians | 82.1 /100 | #139 | Excellent 6.6% |
| Slavs | 81.6 /100 | #140 | Excellent 6.6% |
| Australians | 80.8 /100 | #141 | Excellent 6.6% |
| Immigrants | Iraq | 79.4 /100 | #142 | Good 6.5% |
| Immigrants | Canada | 78.6 /100 | #143 | Good 6.5% |
| Immigrants | North America | 78.5 /100 | #144 | Good 6.5% |
| Croatians | 77.8 /100 | #145 | Good 6.5% |
| Immigrants | Costa Rica | 74.4 /100 | #146 | Good 6.5% |
Demographics Similar to Europeans by 4 or more Vehicles in Household
In terms of 4 or more vehicles in household, the demographic groups most similar to Europeans are Spaniard (7.6%, a difference of 0.26%), Chippewa (7.6%, a difference of 0.26%), Immigrants from Micronesia (7.6%, a difference of 0.27%), Hispanic or Latino (7.6%, a difference of 0.32%), and Pennsylvania German (7.6%, a difference of 0.36%).
| Demographics | Rating | Rank | 4 or more Vehicles in Household |
| Dutch | 100.0 /100 | #54 | Exceptional 7.7% |
| Immigrants | Oceania | 100.0 /100 | #55 | Exceptional 7.6% |
| English | 100.0 /100 | #56 | Exceptional 7.6% |
| Pennsylvania Germans | 100.0 /100 | #57 | Exceptional 7.6% |
| Swedes | 100.0 /100 | #58 | Exceptional 7.6% |
| Hispanics or Latinos | 100.0 /100 | #59 | Exceptional 7.6% |
| Spaniards | 100.0 /100 | #60 | Exceptional 7.6% |
| Europeans | 100.0 /100 | #61 | Exceptional 7.6% |
| Chippewa | 100.0 /100 | #62 | Exceptional 7.6% |
| Immigrants | Micronesia | 100.0 /100 | #63 | Exceptional 7.6% |
| Bangladeshis | 100.0 /100 | #64 | Exceptional 7.6% |
| Immigrants | Azores | 100.0 /100 | #65 | Exceptional 7.5% |
| Immigrants | Taiwan | 99.9 /100 | #66 | Exceptional 7.5% |
| Americans | 99.9 /100 | #67 | Exceptional 7.5% |
| Welsh | 99.9 /100 | #68 | Exceptional 7.5% |