Immigrants from Cambodia vs Comanche 4 or more Vehicles in Household
COMPARE
Immigrants from Cambodia
Comanche
4 or more Vehicles in Household
4 or more Vehicles in Household Comparison
Immigrants from Cambodia
Comanche
7.4%
4 OR MORE VEHICLES IN HOUSEHOLD
99.9/ 100
METRIC RATING
75th/ 347
METRIC RANK
6.8%
4 OR MORE VEHICLES IN HOUSEHOLD
94.8/ 100
METRIC RATING
120th/ 347
METRIC RANK
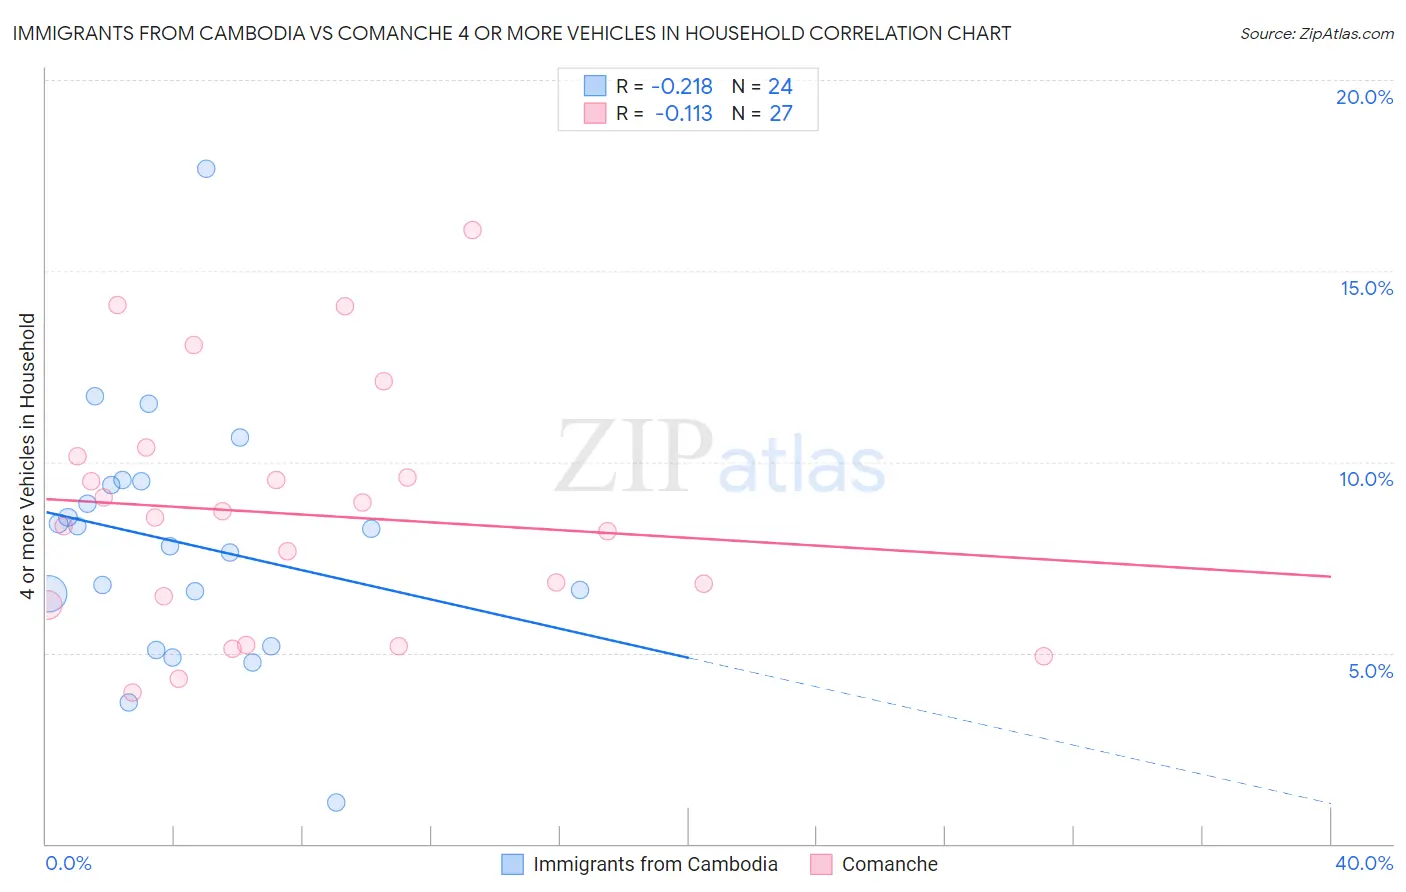
Immigrants from Cambodia vs Comanche 4 or more Vehicles in Household Correlation Chart
The statistical analysis conducted on geographies consisting of 205,078,675 people shows a weak negative correlation between the proportion of Immigrants from Cambodia and percentage of households with 4 or more vehicles available in the United States with a correlation coefficient (R) of -0.218 and weighted average of 7.4%. Similarly, the statistical analysis conducted on geographies consisting of 109,674,295 people shows a poor negative correlation between the proportion of Comanche and percentage of households with 4 or more vehicles available in the United States with a correlation coefficient (R) of -0.113 and weighted average of 6.8%, a difference of 8.7%.
4 or more Vehicles in Household Correlation Summary
| Measurement | Immigrants from Cambodia | Comanche |
| Minimum | 1.1% | 4.0% |
| Maximum | 17.7% | 16.1% |
| Range | 16.6% | 12.1% |
| Mean | 7.9% | 8.6% |
| Median | 8.0% | 8.5% |
| Interquartile 25% (IQ1) | 5.9% | 6.2% |
| Interquartile 75% (IQ3) | 9.4% | 10.1% |
| Interquartile Range (IQR) | 3.6% | 3.9% |
| Standard Deviation (Sample) | 3.3% | 3.2% |
| Standard Deviation (Population) | 3.2% | 3.1% |
Similar Demographics by 4 or more Vehicles in Household
Demographics Similar to Immigrants from Cambodia by 4 or more Vehicles in Household
In terms of 4 or more vehicles in household, the demographic groups most similar to Immigrants from Cambodia are Icelander (7.4%, a difference of 0.0%), Laotian (7.4%, a difference of 0.050%), Apache (7.4%, a difference of 0.22%), White/Caucasian (7.4%, a difference of 0.28%), and Portuguese (7.4%, a difference of 0.31%).
| Demographics | Rating | Rank | 4 or more Vehicles in Household |
| Welsh | 99.9 /100 | #68 | Exceptional 7.5% |
| Germans | 99.9 /100 | #69 | Exceptional 7.5% |
| Scottish | 99.9 /100 | #70 | Exceptional 7.4% |
| Chickasaw | 99.9 /100 | #71 | Exceptional 7.4% |
| Scotch-Irish | 99.9 /100 | #72 | Exceptional 7.4% |
| Portuguese | 99.9 /100 | #73 | Exceptional 7.4% |
| Icelanders | 99.9 /100 | #74 | Exceptional 7.4% |
| Immigrants | Cambodia | 99.9 /100 | #75 | Exceptional 7.4% |
| Laotians | 99.9 /100 | #76 | Exceptional 7.4% |
| Apache | 99.9 /100 | #77 | Exceptional 7.4% |
| Whites/Caucasians | 99.8 /100 | #78 | Exceptional 7.4% |
| Czechs | 99.8 /100 | #79 | Exceptional 7.4% |
| Alaska Natives | 99.8 /100 | #80 | Exceptional 7.3% |
| Finns | 99.8 /100 | #81 | Exceptional 7.3% |
| Northern Europeans | 99.8 /100 | #82 | Exceptional 7.3% |
Demographics Similar to Comanche by 4 or more Vehicles in Household
In terms of 4 or more vehicles in household, the demographic groups most similar to Comanche are Immigrants from Germany (6.8%, a difference of 0.060%), Immigrants from Nicaragua (6.8%, a difference of 0.060%), Immigrants (6.8%, a difference of 0.13%), Immigrants from Asia (6.8%, a difference of 0.23%), and Austrian (6.8%, a difference of 0.32%).
| Demographics | Rating | Rank | 4 or more Vehicles in Household |
| Canadians | 96.4 /100 | #113 | Exceptional 6.9% |
| Bolivians | 96.3 /100 | #114 | Exceptional 6.8% |
| Tlingit-Haida | 96.2 /100 | #115 | Exceptional 6.8% |
| Immigrants | Guatemala | 95.8 /100 | #116 | Exceptional 6.8% |
| Burmese | 95.7 /100 | #117 | Exceptional 6.8% |
| French American Indians | 95.7 /100 | #118 | Exceptional 6.8% |
| Costa Ricans | 95.5 /100 | #119 | Exceptional 6.8% |
| Comanche | 94.8 /100 | #120 | Exceptional 6.8% |
| Immigrants | Germany | 94.7 /100 | #121 | Exceptional 6.8% |
| Immigrants | Nicaragua | 94.7 /100 | #122 | Exceptional 6.8% |
| Immigrants | Immigrants | 94.6 /100 | #123 | Exceptional 6.8% |
| Immigrants | Asia | 94.4 /100 | #124 | Exceptional 6.8% |
| Austrians | 94.1 /100 | #125 | Exceptional 6.8% |
| Belgians | 94.1 /100 | #126 | Exceptional 6.8% |
| Immigrants | Korea | 93.8 /100 | #127 | Exceptional 6.8% |