Immigrants from Burma/Myanmar vs Immigrants from Taiwan 1st Grade
COMPARE
Immigrants from Burma/Myanmar
Immigrants from Taiwan
1st Grade
1st Grade Comparison
Immigrants from Burma/Myanmar
Immigrants from Taiwan
96.8%
1ST GRADE
0.0/ 100
METRIC RATING
320th/ 347
METRIC RANK
97.9%
1ST GRADE
29.4/ 100
METRIC RATING
193rd/ 347
METRIC RANK
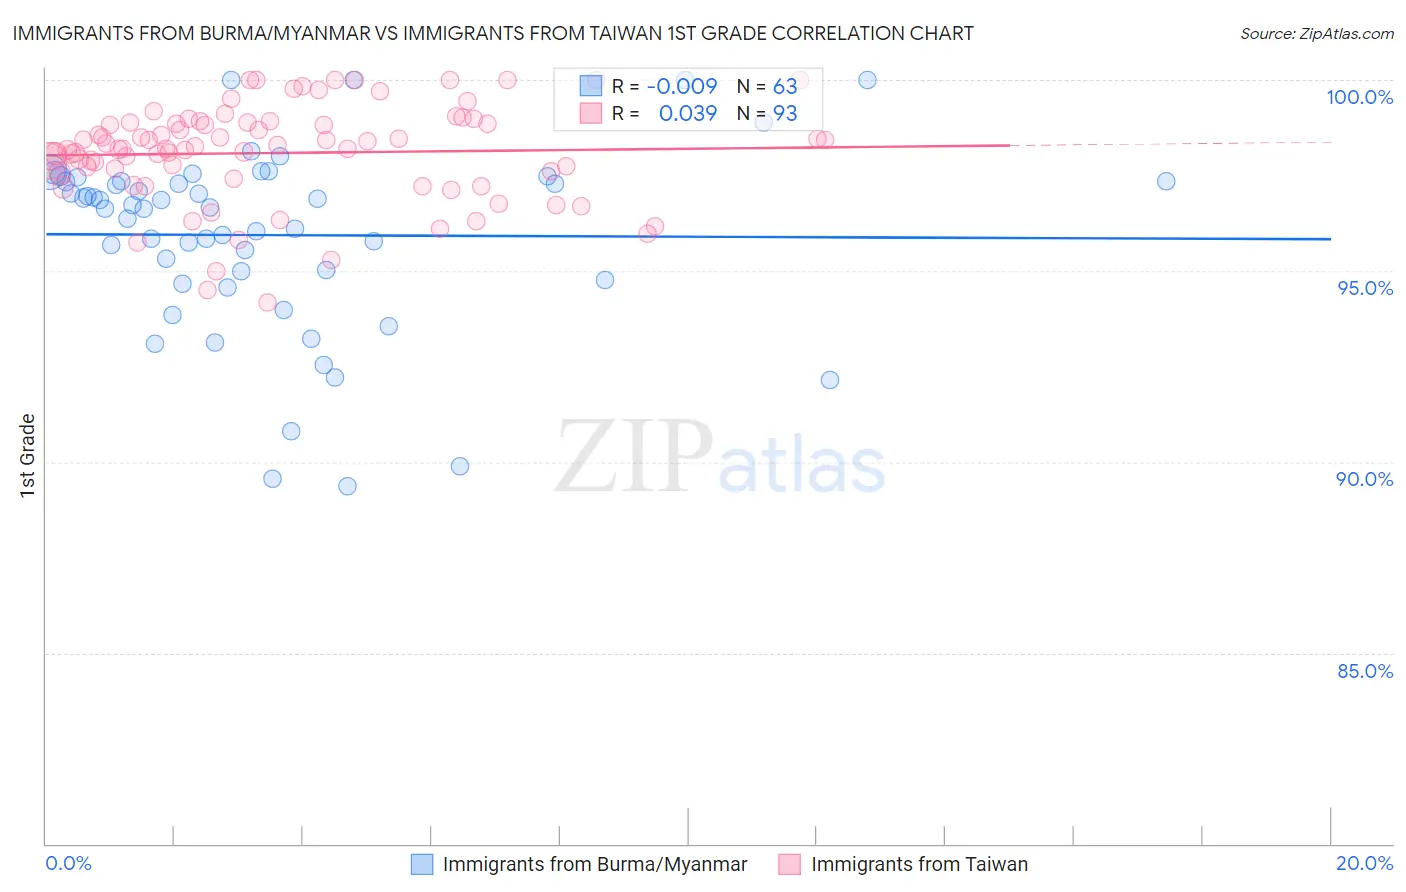
Immigrants from Burma/Myanmar vs Immigrants from Taiwan 1st Grade Correlation Chart
The statistical analysis conducted on geographies consisting of 172,338,093 people shows no correlation between the proportion of Immigrants from Burma/Myanmar and percentage of population with at least 1st grade education in the United States with a correlation coefficient (R) of -0.009 and weighted average of 96.8%. Similarly, the statistical analysis conducted on geographies consisting of 298,069,082 people shows no correlation between the proportion of Immigrants from Taiwan and percentage of population with at least 1st grade education in the United States with a correlation coefficient (R) of 0.039 and weighted average of 97.9%, a difference of 1.1%.
1st Grade Correlation Summary
| Measurement | Immigrants from Burma/Myanmar | Immigrants from Taiwan |
| Minimum | 89.4% | 94.2% |
| Maximum | 100.0% | 100.0% |
| Range | 10.6% | 5.8% |
| Mean | 95.9% | 98.1% |
| Median | 96.6% | 98.2% |
| Interquartile 25% (IQ1) | 94.8% | 97.5% |
| Interquartile 75% (IQ3) | 97.4% | 98.9% |
| Interquartile Range (IQR) | 2.6% | 1.4% |
| Standard Deviation (Sample) | 2.4% | 1.3% |
| Standard Deviation (Population) | 2.4% | 1.3% |
Similar Demographics by 1st Grade
Demographics Similar to Immigrants from Burma/Myanmar by 1st Grade
In terms of 1st grade, the demographic groups most similar to Immigrants from Burma/Myanmar are Immigrants from Guyana (96.8%, a difference of 0.0%), Immigrants from Bangladesh (96.8%, a difference of 0.010%), Immigrants from Laos (96.8%, a difference of 0.020%), Mexican American Indian (96.8%, a difference of 0.020%), and Immigrants from Honduras (96.8%, a difference of 0.030%).
| Demographics | Rating | Rank | 1st Grade |
| Guyanese | 0.0 /100 | #313 | Tragic 96.9% |
| Hondurans | 0.0 /100 | #314 | Tragic 96.9% |
| Immigrants | Belize | 0.0 /100 | #315 | Tragic 96.9% |
| Immigrants | Ecuador | 0.0 /100 | #316 | Tragic 96.9% |
| Immigrants | Nicaragua | 0.0 /100 | #317 | Tragic 96.9% |
| Immigrants | Laos | 0.0 /100 | #318 | Tragic 96.8% |
| Immigrants | Guyana | 0.0 /100 | #319 | Tragic 96.8% |
| Immigrants | Burma/Myanmar | 0.0 /100 | #320 | Tragic 96.8% |
| Immigrants | Bangladesh | 0.0 /100 | #321 | Tragic 96.8% |
| Mexican American Indians | 0.0 /100 | #322 | Tragic 96.8% |
| Immigrants | Honduras | 0.0 /100 | #323 | Tragic 96.8% |
| Vietnamese | 0.0 /100 | #324 | Tragic 96.8% |
| Dominicans | 0.0 /100 | #325 | Tragic 96.7% |
| Indonesians | 0.0 /100 | #326 | Tragic 96.7% |
| Mexicans | 0.0 /100 | #327 | Tragic 96.7% |
Demographics Similar to Immigrants from Taiwan by 1st Grade
In terms of 1st grade, the demographic groups most similar to Immigrants from Taiwan are Black/African American (97.9%, a difference of 0.0%), Paraguayan (97.9%, a difference of 0.0%), Mongolian (97.9%, a difference of 0.0%), Hawaiian (97.9%, a difference of 0.0%), and Immigrants from Kenya (97.8%, a difference of 0.010%).
| Demographics | Rating | Rank | 1st Grade |
| Paiute | 36.5 /100 | #186 | Fair 97.9% |
| Pakistanis | 35.8 /100 | #187 | Fair 97.9% |
| Arabs | 35.5 /100 | #188 | Fair 97.9% |
| Immigrants | Kazakhstan | 34.9 /100 | #189 | Fair 97.9% |
| Panamanians | 34.1 /100 | #190 | Fair 97.9% |
| Blacks/African Americans | 30.7 /100 | #191 | Fair 97.9% |
| Paraguayans | 30.2 /100 | #192 | Fair 97.9% |
| Immigrants | Taiwan | 29.4 /100 | #193 | Fair 97.9% |
| Mongolians | 29.2 /100 | #194 | Fair 97.9% |
| Hawaiians | 28.8 /100 | #195 | Fair 97.9% |
| Immigrants | Kenya | 26.3 /100 | #196 | Fair 97.8% |
| Guamanians/Chamorros | 26.2 /100 | #197 | Fair 97.8% |
| Yuman | 24.4 /100 | #198 | Fair 97.8% |
| Tohono O'odham | 23.2 /100 | #199 | Fair 97.8% |
| Immigrants | Egypt | 22.6 /100 | #200 | Fair 97.8% |