Immigrants from Brazil vs Cree 4 or more Vehicles in Household
COMPARE
Immigrants from Brazil
Cree
4 or more Vehicles in Household
4 or more Vehicles in Household Comparison
Immigrants from Brazil
Cree
5.2%
4 OR MORE VEHICLES IN HOUSEHOLD
0.1/ 100
METRIC RATING
295th/ 347
METRIC RANK
7.2%
4 OR MORE VEHICLES IN HOUSEHOLD
99.7/ 100
METRIC RATING
85th/ 347
METRIC RANK
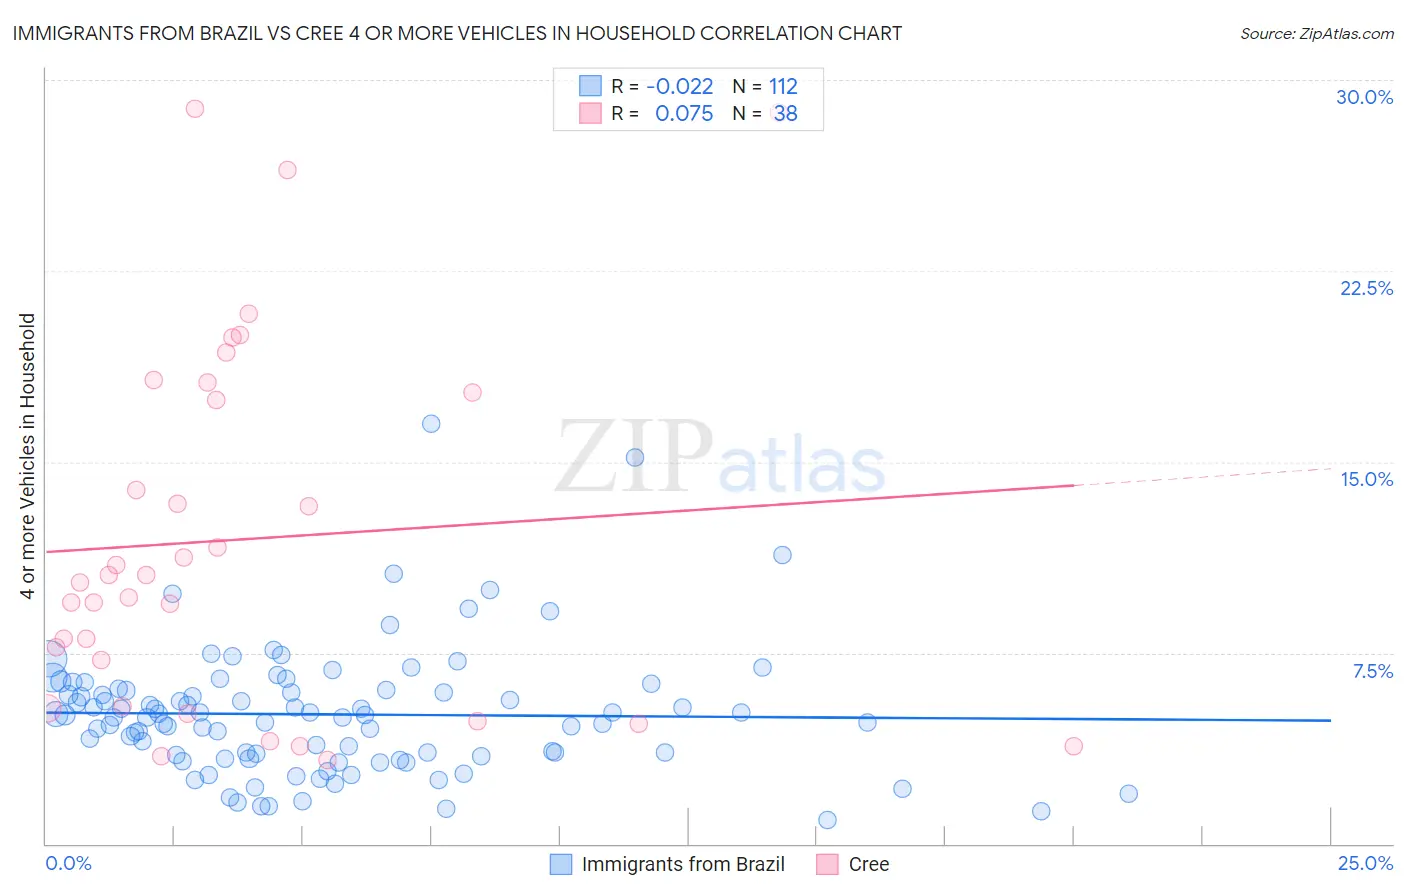
Immigrants from Brazil vs Cree 4 or more Vehicles in Household Correlation Chart
The statistical analysis conducted on geographies consisting of 341,468,936 people shows no correlation between the proportion of Immigrants from Brazil and percentage of households with 4 or more vehicles available in the United States with a correlation coefficient (R) of -0.022 and weighted average of 5.2%. Similarly, the statistical analysis conducted on geographies consisting of 76,129,414 people shows a slight positive correlation between the proportion of Cree and percentage of households with 4 or more vehicles available in the United States with a correlation coefficient (R) of 0.075 and weighted average of 7.2%, a difference of 38.2%.
4 or more Vehicles in Household Correlation Summary
| Measurement | Immigrants from Brazil | Cree |
| Minimum | 0.95% | 3.3% |
| Maximum | 16.5% | 28.9% |
| Range | 15.6% | 25.5% |
| Mean | 5.1% | 11.9% |
| Median | 5.0% | 10.4% |
| Interquartile 25% (IQ1) | 3.5% | 5.4% |
| Interquartile 75% (IQ3) | 6.0% | 17.7% |
| Interquartile Range (IQR) | 2.6% | 12.3% |
| Standard Deviation (Sample) | 2.5% | 7.1% |
| Standard Deviation (Population) | 2.5% | 7.0% |
Similar Demographics by 4 or more Vehicles in Household
Demographics Similar to Immigrants from Brazil by 4 or more Vehicles in Household
In terms of 4 or more vehicles in household, the demographic groups most similar to Immigrants from Brazil are Ghanaian (5.2%, a difference of 0.11%), Immigrants from Congo (5.2%, a difference of 0.17%), Israeli (5.2%, a difference of 0.18%), Liberian (5.3%, a difference of 0.20%), and Immigrants from Bahamas (5.3%, a difference of 0.30%).
| Demographics | Rating | Rank | 4 or more Vehicles in Household |
| Venezuelans | 0.2 /100 | #288 | Tragic 5.3% |
| Immigrants | Bosnia and Herzegovina | 0.2 /100 | #289 | Tragic 5.3% |
| Immigrants | Russia | 0.2 /100 | #290 | Tragic 5.3% |
| Immigrants | Bahamas | 0.1 /100 | #291 | Tragic 5.3% |
| Liberians | 0.1 /100 | #292 | Tragic 5.3% |
| Immigrants | Congo | 0.1 /100 | #293 | Tragic 5.2% |
| Ghanaians | 0.1 /100 | #294 | Tragic 5.2% |
| Immigrants | Brazil | 0.1 /100 | #295 | Tragic 5.2% |
| Israelis | 0.1 /100 | #296 | Tragic 5.2% |
| Immigrants | Venezuela | 0.1 /100 | #297 | Tragic 5.2% |
| Immigrants | South America | 0.1 /100 | #298 | Tragic 5.2% |
| Immigrants | Ghana | 0.1 /100 | #299 | Tragic 5.2% |
| Immigrants | Morocco | 0.0 /100 | #300 | Tragic 5.1% |
| Immigrants | Zaire | 0.0 /100 | #301 | Tragic 5.1% |
| Bahamians | 0.0 /100 | #302 | Tragic 5.1% |
Demographics Similar to Cree by 4 or more Vehicles in Household
In terms of 4 or more vehicles in household, the demographic groups most similar to Cree are Afghan (7.3%, a difference of 0.17%), Immigrants from Indonesia (7.2%, a difference of 0.18%), Delaware (7.2%, a difference of 0.24%), Nonimmigrants (7.2%, a difference of 0.26%), and Potawatomi (7.3%, a difference of 0.49%).
| Demographics | Rating | Rank | 4 or more Vehicles in Household |
| Whites/Caucasians | 99.8 /100 | #78 | Exceptional 7.4% |
| Czechs | 99.8 /100 | #79 | Exceptional 7.4% |
| Alaska Natives | 99.8 /100 | #80 | Exceptional 7.3% |
| Finns | 99.8 /100 | #81 | Exceptional 7.3% |
| Northern Europeans | 99.8 /100 | #82 | Exceptional 7.3% |
| Potawatomi | 99.7 /100 | #83 | Exceptional 7.3% |
| Afghans | 99.7 /100 | #84 | Exceptional 7.3% |
| Cree | 99.7 /100 | #85 | Exceptional 7.2% |
| Immigrants | Indonesia | 99.6 /100 | #86 | Exceptional 7.2% |
| Delaware | 99.6 /100 | #87 | Exceptional 7.2% |
| Immigrants | Nonimmigrants | 99.6 /100 | #88 | Exceptional 7.2% |
| British | 99.6 /100 | #89 | Exceptional 7.2% |
| Creek | 99.6 /100 | #90 | Exceptional 7.2% |
| Assyrians/Chaldeans/Syriacs | 99.4 /100 | #91 | Exceptional 7.2% |
| Immigrants | Latin America | 99.4 /100 | #92 | Exceptional 7.1% |