Immigrants from Bangladesh vs Immigrants from Lebanon 4 or more Vehicles in Household
COMPARE
Immigrants from Bangladesh
Immigrants from Lebanon
4 or more Vehicles in Household
4 or more Vehicles in Household Comparison
Immigrants from Bangladesh
Immigrants from Lebanon
3.9%
4 OR MORE VEHICLES IN HOUSEHOLD
0.0/ 100
METRIC RATING
336th/ 347
METRIC RANK
6.3%
4 OR MORE VEHICLES IN HOUSEHOLD
51.7/ 100
METRIC RATING
172nd/ 347
METRIC RANK
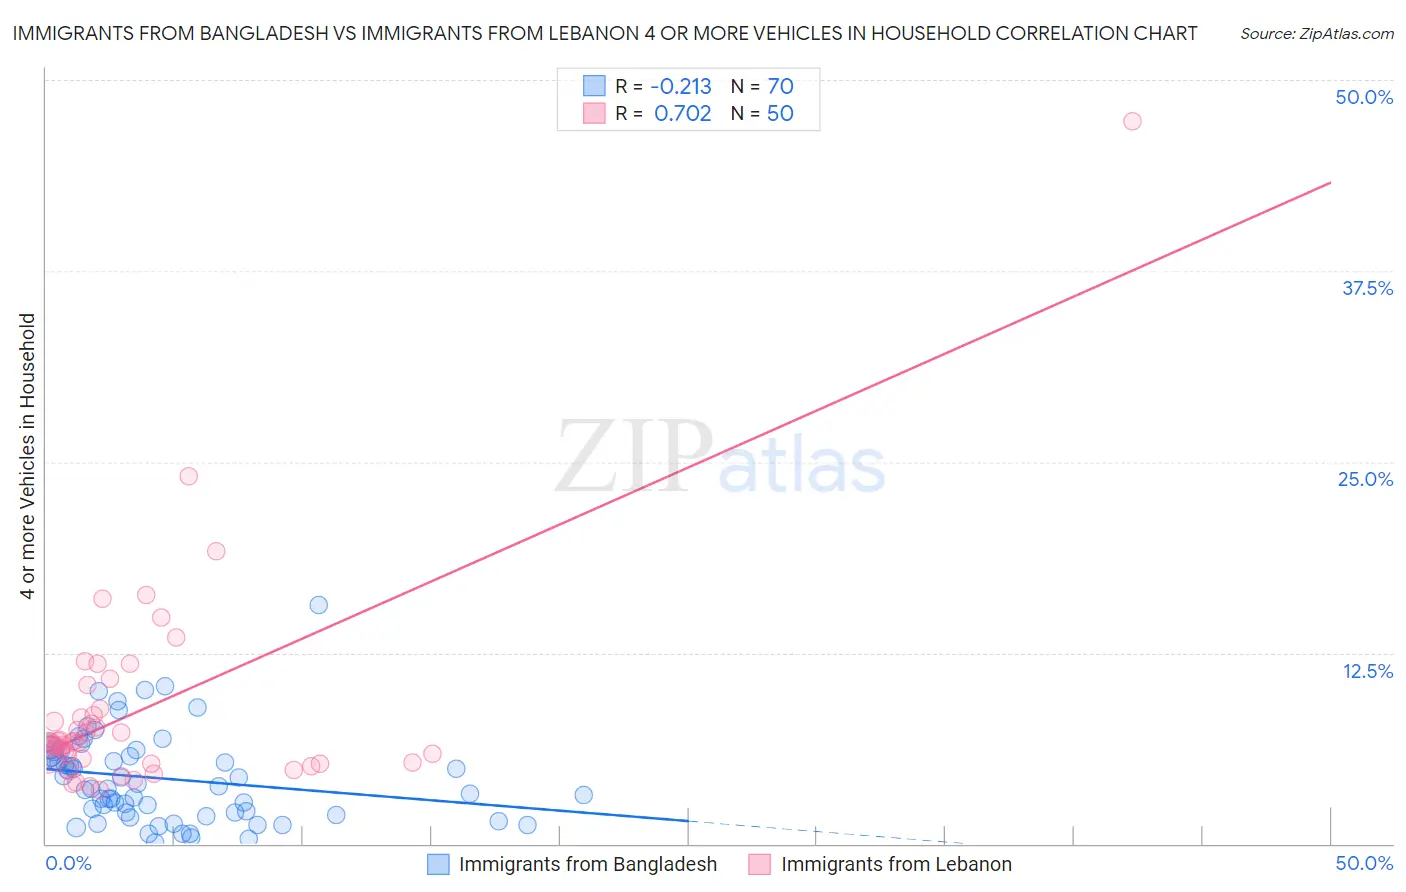
Immigrants from Bangladesh vs Immigrants from Lebanon 4 or more Vehicles in Household Correlation Chart
The statistical analysis conducted on geographies consisting of 202,683,099 people shows a weak negative correlation between the proportion of Immigrants from Bangladesh and percentage of households with 4 or more vehicles available in the United States with a correlation coefficient (R) of -0.213 and weighted average of 3.9%. Similarly, the statistical analysis conducted on geographies consisting of 216,708,139 people shows a strong positive correlation between the proportion of Immigrants from Lebanon and percentage of households with 4 or more vehicles available in the United States with a correlation coefficient (R) of 0.702 and weighted average of 6.3%, a difference of 62.5%.
4 or more Vehicles in Household Correlation Summary
| Measurement | Immigrants from Bangladesh | Immigrants from Lebanon |
| Minimum | 0.081% | 3.5% |
| Maximum | 15.6% | 47.3% |
| Range | 15.6% | 43.7% |
| Mean | 4.3% | 8.8% |
| Median | 3.7% | 6.6% |
| Interquartile 25% (IQ1) | 2.0% | 5.3% |
| Interquartile 75% (IQ3) | 6.1% | 8.8% |
| Interquartile Range (IQR) | 4.1% | 3.6% |
| Standard Deviation (Sample) | 2.9% | 7.0% |
| Standard Deviation (Population) | 2.9% | 6.9% |
Similar Demographics by 4 or more Vehicles in Household
Demographics Similar to Immigrants from Bangladesh by 4 or more Vehicles in Household
In terms of 4 or more vehicles in household, the demographic groups most similar to Immigrants from Bangladesh are Barbadian (3.9%, a difference of 0.18%), Vietnamese (3.9%, a difference of 0.51%), Immigrants from Cabo Verde (3.8%, a difference of 2.4%), Immigrants from Trinidad and Tobago (4.1%, a difference of 5.3%), and Immigrants from Albania (4.1%, a difference of 5.6%).
| Demographics | Rating | Rank | 4 or more Vehicles in Household |
| Immigrants | Senegal | 0.0 /100 | #329 | Tragic 4.2% |
| Immigrants | Ecuador | 0.0 /100 | #330 | Tragic 4.2% |
| West Indians | 0.0 /100 | #331 | Tragic 4.2% |
| Immigrants | Dominica | 0.0 /100 | #332 | Tragic 4.2% |
| Immigrants | Albania | 0.0 /100 | #333 | Tragic 4.1% |
| Immigrants | Trinidad and Tobago | 0.0 /100 | #334 | Tragic 4.1% |
| Barbadians | 0.0 /100 | #335 | Tragic 3.9% |
| Immigrants | Bangladesh | 0.0 /100 | #336 | Tragic 3.9% |
| Vietnamese | 0.0 /100 | #337 | Tragic 3.9% |
| Immigrants | Cabo Verde | 0.0 /100 | #338 | Tragic 3.8% |
| Immigrants | Uzbekistan | 0.0 /100 | #339 | Tragic 3.6% |
| Immigrants | Barbados | 0.0 /100 | #340 | Tragic 3.6% |
| Dominicans | 0.0 /100 | #341 | Tragic 3.5% |
| Guyanese | 0.0 /100 | #342 | Tragic 3.5% |
| British West Indians | 0.0 /100 | #343 | Tragic 3.5% |
Demographics Similar to Immigrants from Lebanon by 4 or more Vehicles in Household
In terms of 4 or more vehicles in household, the demographic groups most similar to Immigrants from Lebanon are Immigrants from India (6.3%, a difference of 0.020%), Slovene (6.3%, a difference of 0.060%), Immigrants from Syria (6.3%, a difference of 0.11%), Lithuanian (6.3%, a difference of 0.17%), and Immigrants from Western Europe (6.3%, a difference of 0.29%).
| Demographics | Rating | Rank | 4 or more Vehicles in Household |
| Immigrants | Peru | 59.8 /100 | #165 | Average 6.4% |
| Immigrants | Denmark | 57.8 /100 | #166 | Average 6.4% |
| Poles | 56.9 /100 | #167 | Average 6.4% |
| Lebanese | 55.8 /100 | #168 | Average 6.4% |
| Estonians | 55.1 /100 | #169 | Average 6.4% |
| Immigrants | Syria | 52.8 /100 | #170 | Average 6.3% |
| Immigrants | India | 51.9 /100 | #171 | Average 6.3% |
| Immigrants | Lebanon | 51.7 /100 | #172 | Average 6.3% |
| Slovenes | 51.1 /100 | #173 | Average 6.3% |
| Lithuanians | 50.0 /100 | #174 | Average 6.3% |
| Immigrants | Western Europe | 48.8 /100 | #175 | Average 6.3% |
| Ukrainians | 47.6 /100 | #176 | Average 6.3% |
| Slovaks | 46.9 /100 | #177 | Average 6.3% |
| Belizeans | 44.5 /100 | #178 | Average 6.3% |
| Immigrants | Japan | 43.1 /100 | #179 | Average 6.3% |