Immigrants from Bangladesh vs Immigrants from Netherlands 4 or more Vehicles in Household
COMPARE
Immigrants from Bangladesh
Immigrants from Netherlands
4 or more Vehicles in Household
4 or more Vehicles in Household Comparison
Immigrants from Bangladesh
Immigrants from Netherlands
3.9%
4 OR MORE VEHICLES IN HOUSEHOLD
0.0/ 100
METRIC RATING
336th/ 347
METRIC RANK
6.6%
4 OR MORE VEHICLES IN HOUSEHOLD
87.8/ 100
METRIC RATING
132nd/ 347
METRIC RANK
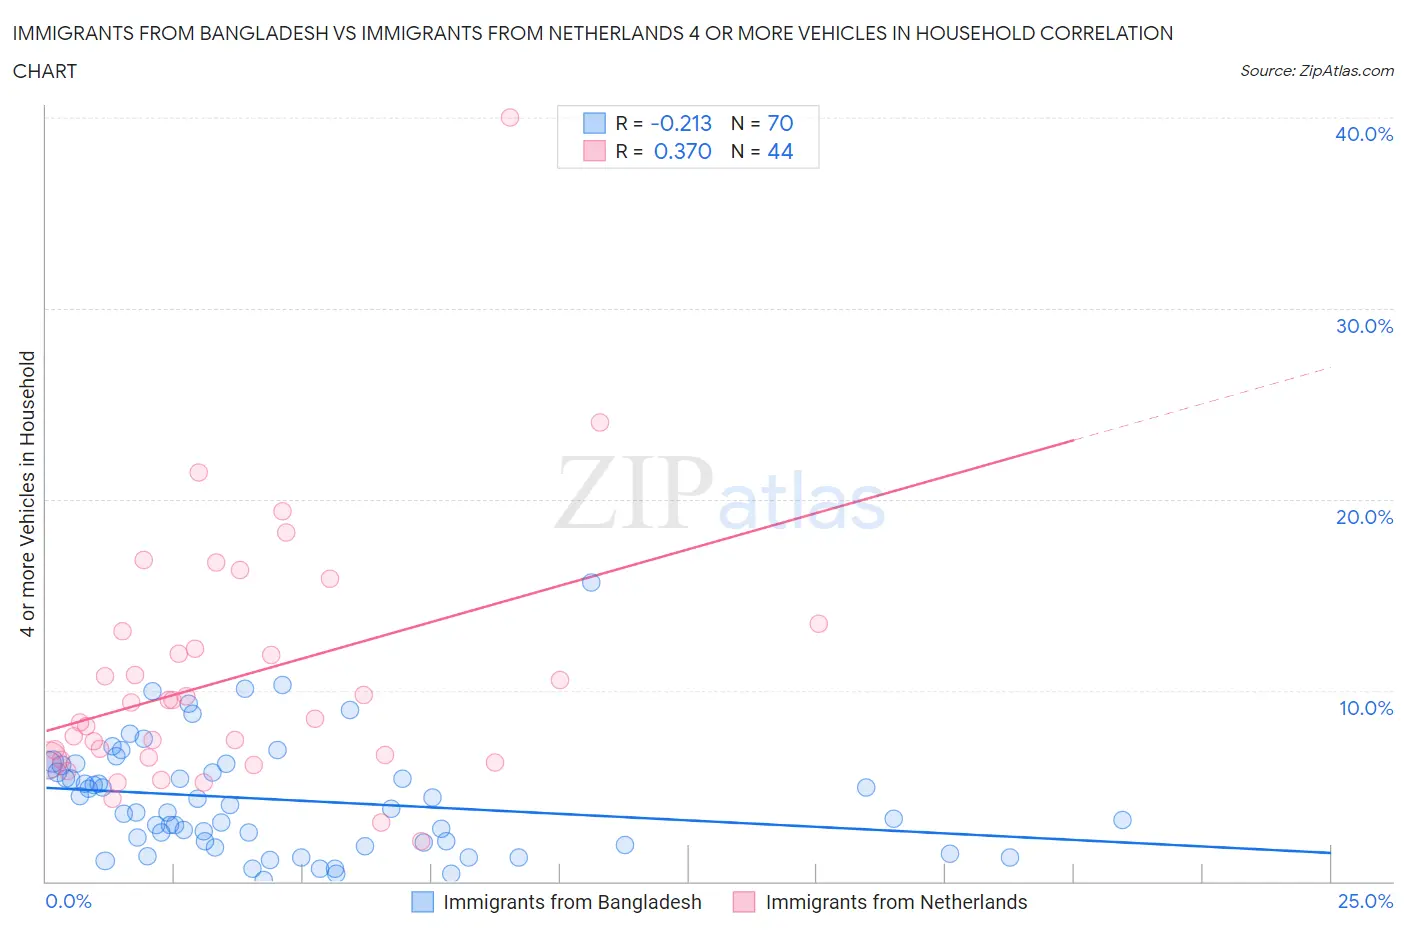
Immigrants from Bangladesh vs Immigrants from Netherlands 4 or more Vehicles in Household Correlation Chart
The statistical analysis conducted on geographies consisting of 202,683,099 people shows a weak negative correlation between the proportion of Immigrants from Bangladesh and percentage of households with 4 or more vehicles available in the United States with a correlation coefficient (R) of -0.213 and weighted average of 3.9%. Similarly, the statistical analysis conducted on geographies consisting of 237,226,549 people shows a mild positive correlation between the proportion of Immigrants from Netherlands and percentage of households with 4 or more vehicles available in the United States with a correlation coefficient (R) of 0.370 and weighted average of 6.6%, a difference of 70.4%.
4 or more Vehicles in Household Correlation Summary
| Measurement | Immigrants from Bangladesh | Immigrants from Netherlands |
| Minimum | 0.081% | 2.1% |
| Maximum | 15.6% | 40.0% |
| Range | 15.6% | 37.9% |
| Mean | 4.3% | 10.6% |
| Median | 3.7% | 8.9% |
| Interquartile 25% (IQ1) | 2.0% | 6.4% |
| Interquartile 75% (IQ3) | 6.1% | 12.6% |
| Interquartile Range (IQR) | 4.1% | 6.2% |
| Standard Deviation (Sample) | 2.9% | 6.7% |
| Standard Deviation (Population) | 2.9% | 6.6% |
Similar Demographics by 4 or more Vehicles in Household
Demographics Similar to Immigrants from Bangladesh by 4 or more Vehicles in Household
In terms of 4 or more vehicles in household, the demographic groups most similar to Immigrants from Bangladesh are Barbadian (3.9%, a difference of 0.18%), Vietnamese (3.9%, a difference of 0.51%), Immigrants from Cabo Verde (3.8%, a difference of 2.4%), Immigrants from Trinidad and Tobago (4.1%, a difference of 5.3%), and Immigrants from Albania (4.1%, a difference of 5.6%).
| Demographics | Rating | Rank | 4 or more Vehicles in Household |
| Immigrants | Senegal | 0.0 /100 | #329 | Tragic 4.2% |
| Immigrants | Ecuador | 0.0 /100 | #330 | Tragic 4.2% |
| West Indians | 0.0 /100 | #331 | Tragic 4.2% |
| Immigrants | Dominica | 0.0 /100 | #332 | Tragic 4.2% |
| Immigrants | Albania | 0.0 /100 | #333 | Tragic 4.1% |
| Immigrants | Trinidad and Tobago | 0.0 /100 | #334 | Tragic 4.1% |
| Barbadians | 0.0 /100 | #335 | Tragic 3.9% |
| Immigrants | Bangladesh | 0.0 /100 | #336 | Tragic 3.9% |
| Vietnamese | 0.0 /100 | #337 | Tragic 3.9% |
| Immigrants | Cabo Verde | 0.0 /100 | #338 | Tragic 3.8% |
| Immigrants | Uzbekistan | 0.0 /100 | #339 | Tragic 3.6% |
| Immigrants | Barbados | 0.0 /100 | #340 | Tragic 3.6% |
| Dominicans | 0.0 /100 | #341 | Tragic 3.5% |
| Guyanese | 0.0 /100 | #342 | Tragic 3.5% |
| British West Indians | 0.0 /100 | #343 | Tragic 3.5% |
Demographics Similar to Immigrants from Netherlands by 4 or more Vehicles in Household
In terms of 4 or more vehicles in household, the demographic groups most similar to Immigrants from Netherlands are Maltese (6.7%, a difference of 0.14%), Armenian (6.6%, a difference of 0.19%), Ottawa (6.6%, a difference of 0.21%), Tohono O'odham (6.6%, a difference of 0.24%), and Immigrants from Scotland (6.7%, a difference of 0.29%).
| Demographics | Rating | Rank | 4 or more Vehicles in Household |
| Austrians | 94.1 /100 | #125 | Exceptional 6.8% |
| Belgians | 94.1 /100 | #126 | Exceptional 6.8% |
| Immigrants | Korea | 93.8 /100 | #127 | Exceptional 6.8% |
| Immigrants | Bolivia | 92.5 /100 | #128 | Exceptional 6.7% |
| Immigrants | England | 92.0 /100 | #129 | Exceptional 6.7% |
| Immigrants | Scotland | 89.0 /100 | #130 | Excellent 6.7% |
| Maltese | 88.4 /100 | #131 | Excellent 6.7% |
| Immigrants | Netherlands | 87.8 /100 | #132 | Excellent 6.6% |
| Armenians | 86.9 /100 | #133 | Excellent 6.6% |
| Ottawa | 86.9 /100 | #134 | Excellent 6.6% |
| Tohono O'odham | 86.7 /100 | #135 | Excellent 6.6% |
| Luxembourgers | 86.4 /100 | #136 | Excellent 6.6% |
| French Canadians | 85.4 /100 | #137 | Excellent 6.6% |
| Italians | 84.5 /100 | #138 | Excellent 6.6% |
| Jordanians | 82.1 /100 | #139 | Excellent 6.6% |