Immigrants from the Azores vs Spanish 4 or more Vehicles in Household
COMPARE
Immigrants from the Azores
Spanish
4 or more Vehicles in Household
4 or more Vehicles in Household Comparison
Immigrants from the Azores
Spanish
7.5%
4 OR MORE VEHICLES IN HOUSEHOLD
100.0/ 100
METRIC RATING
65th/ 347
METRIC RANK
7.9%
4 OR MORE VEHICLES IN HOUSEHOLD
100.0/ 100
METRIC RATING
40th/ 347
METRIC RANK
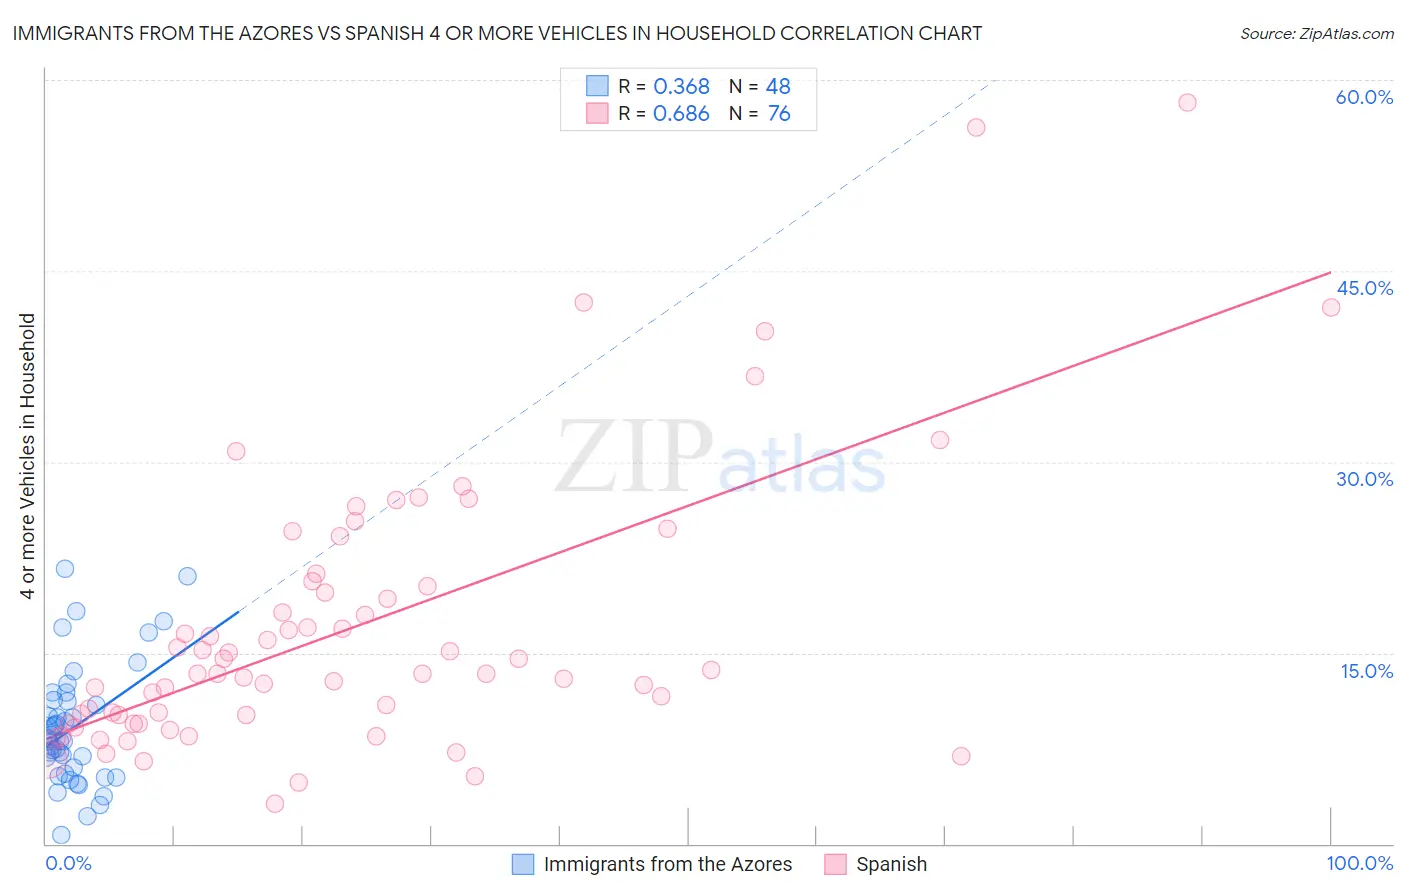
Immigrants from the Azores vs Spanish 4 or more Vehicles in Household Correlation Chart
The statistical analysis conducted on geographies consisting of 46,225,875 people shows a mild positive correlation between the proportion of Immigrants from the Azores and percentage of households with 4 or more vehicles available in the United States with a correlation coefficient (R) of 0.368 and weighted average of 7.5%. Similarly, the statistical analysis conducted on geographies consisting of 420,497,284 people shows a significant positive correlation between the proportion of Spanish and percentage of households with 4 or more vehicles available in the United States with a correlation coefficient (R) of 0.686 and weighted average of 7.9%, a difference of 4.8%.
4 or more Vehicles in Household Correlation Summary
| Measurement | Immigrants from the Azores | Spanish |
| Minimum | 0.74% | 3.2% |
| Maximum | 21.6% | 58.2% |
| Range | 20.9% | 55.0% |
| Mean | 9.2% | 17.0% |
| Median | 8.1% | 13.4% |
| Interquartile 25% (IQ1) | 5.8% | 9.8% |
| Interquartile 75% (IQ3) | 11.3% | 20.4% |
| Interquartile Range (IQR) | 5.5% | 10.7% |
| Standard Deviation (Sample) | 4.7% | 11.0% |
| Standard Deviation (Population) | 4.6% | 10.9% |
Similar Demographics by 4 or more Vehicles in Household
Demographics Similar to Immigrants from the Azores by 4 or more Vehicles in Household
In terms of 4 or more vehicles in household, the demographic groups most similar to Immigrants from the Azores are Bangladeshi (7.6%, a difference of 0.040%), Immigrants from Micronesia (7.6%, a difference of 0.28%), Chippewa (7.6%, a difference of 0.29%), Immigrants from Taiwan (7.5%, a difference of 0.33%), and American (7.5%, a difference of 0.34%).
| Demographics | Rating | Rank | 4 or more Vehicles in Household |
| Swedes | 100.0 /100 | #58 | Exceptional 7.6% |
| Hispanics or Latinos | 100.0 /100 | #59 | Exceptional 7.6% |
| Spaniards | 100.0 /100 | #60 | Exceptional 7.6% |
| Europeans | 100.0 /100 | #61 | Exceptional 7.6% |
| Chippewa | 100.0 /100 | #62 | Exceptional 7.6% |
| Immigrants | Micronesia | 100.0 /100 | #63 | Exceptional 7.6% |
| Bangladeshis | 100.0 /100 | #64 | Exceptional 7.6% |
| Immigrants | Azores | 100.0 /100 | #65 | Exceptional 7.5% |
| Immigrants | Taiwan | 99.9 /100 | #66 | Exceptional 7.5% |
| Americans | 99.9 /100 | #67 | Exceptional 7.5% |
| Welsh | 99.9 /100 | #68 | Exceptional 7.5% |
| Germans | 99.9 /100 | #69 | Exceptional 7.5% |
| Scottish | 99.9 /100 | #70 | Exceptional 7.4% |
| Chickasaw | 99.9 /100 | #71 | Exceptional 7.4% |
| Scotch-Irish | 99.9 /100 | #72 | Exceptional 7.4% |
Demographics Similar to Spanish by 4 or more Vehicles in Household
In terms of 4 or more vehicles in household, the demographic groups most similar to Spanish are Pima (7.9%, a difference of 0.57%), Spanish American (8.0%, a difference of 0.63%), Sioux (8.0%, a difference of 0.86%), Scandinavian (8.0%, a difference of 0.89%), and Norwegian (8.0%, a difference of 1.1%).
| Demographics | Rating | Rank | 4 or more Vehicles in Household |
| Yaqui | 100.0 /100 | #33 | Exceptional 8.1% |
| Alaskan Athabascans | 100.0 /100 | #34 | Exceptional 8.1% |
| Guamanians/Chamorros | 100.0 /100 | #35 | Exceptional 8.1% |
| Norwegians | 100.0 /100 | #36 | Exceptional 8.0% |
| Scandinavians | 100.0 /100 | #37 | Exceptional 8.0% |
| Sioux | 100.0 /100 | #38 | Exceptional 8.0% |
| Spanish Americans | 100.0 /100 | #39 | Exceptional 8.0% |
| Spanish | 100.0 /100 | #40 | Exceptional 7.9% |
| Pima | 100.0 /100 | #41 | Exceptional 7.9% |
| Salvadorans | 100.0 /100 | #42 | Exceptional 7.8% |
| Fijians | 100.0 /100 | #43 | Exceptional 7.8% |
| Bhutanese | 100.0 /100 | #44 | Exceptional 7.8% |
| Choctaw | 100.0 /100 | #45 | Exceptional 7.8% |
| Crow | 100.0 /100 | #46 | Exceptional 7.8% |
| Osage | 100.0 /100 | #47 | Exceptional 7.8% |