Cambodian vs Spanish 4 or more Vehicles in Household
COMPARE
Cambodian
Spanish
4 or more Vehicles in Household
4 or more Vehicles in Household Comparison
Cambodians
Spanish
5.5%
4 OR MORE VEHICLES IN HOUSEHOLD
0.5/ 100
METRIC RATING
275th/ 347
METRIC RANK
7.9%
4 OR MORE VEHICLES IN HOUSEHOLD
100.0/ 100
METRIC RATING
40th/ 347
METRIC RANK
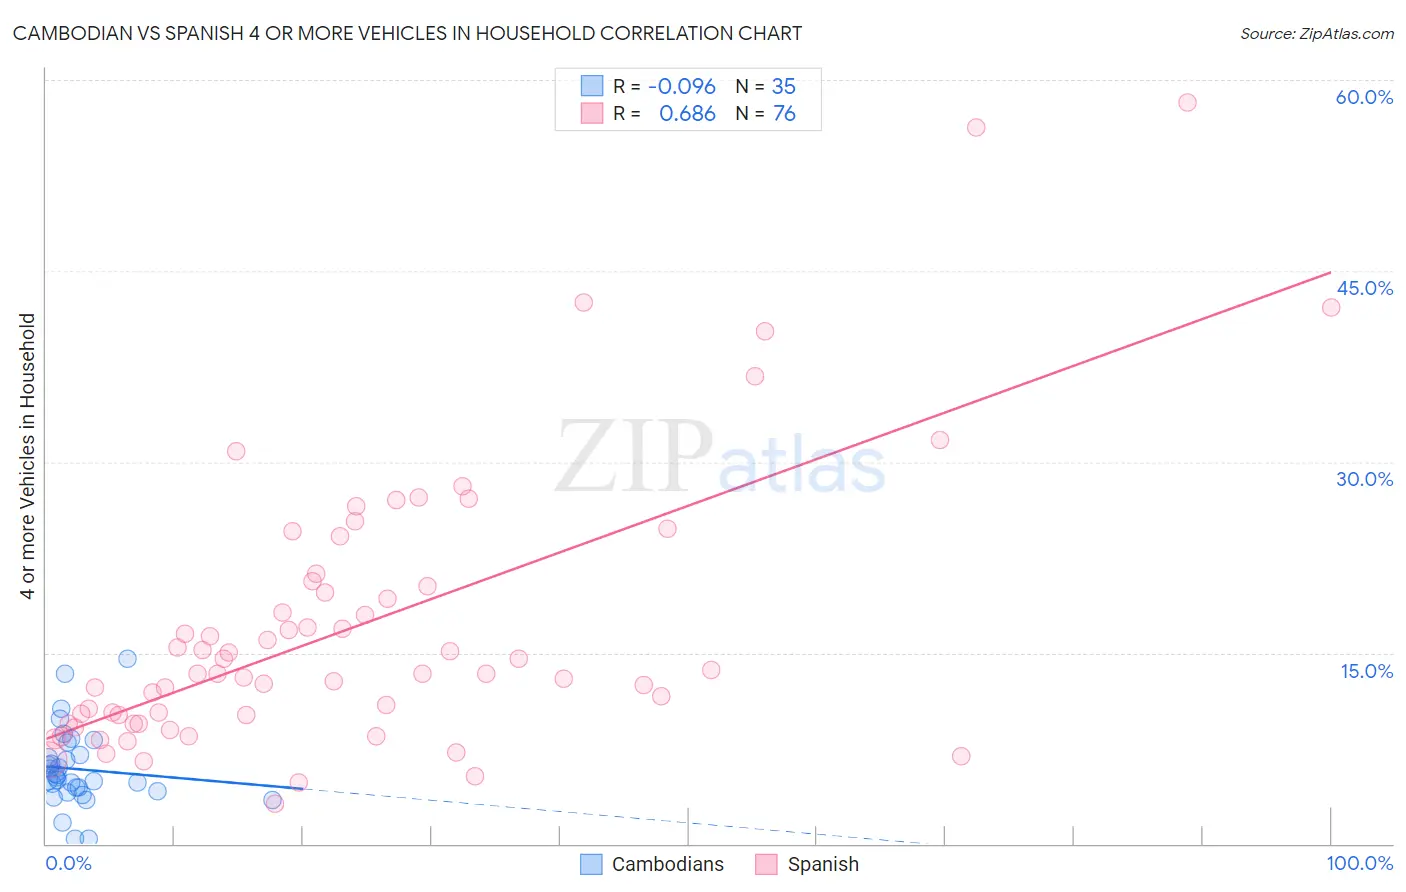
Cambodian vs Spanish 4 or more Vehicles in Household Correlation Chart
The statistical analysis conducted on geographies consisting of 102,385,573 people shows a slight negative correlation between the proportion of Cambodians and percentage of households with 4 or more vehicles available in the United States with a correlation coefficient (R) of -0.096 and weighted average of 5.5%. Similarly, the statistical analysis conducted on geographies consisting of 420,497,284 people shows a significant positive correlation between the proportion of Spanish and percentage of households with 4 or more vehicles available in the United States with a correlation coefficient (R) of 0.686 and weighted average of 7.9%, a difference of 44.1%.
4 or more Vehicles in Household Correlation Summary
| Measurement | Cambodian | Spanish |
| Minimum | 0.37% | 3.2% |
| Maximum | 14.5% | 58.2% |
| Range | 14.1% | 55.0% |
| Mean | 5.9% | 17.0% |
| Median | 5.2% | 13.4% |
| Interquartile 25% (IQ1) | 4.2% | 9.8% |
| Interquartile 75% (IQ3) | 7.0% | 20.4% |
| Interquartile Range (IQR) | 2.9% | 10.7% |
| Standard Deviation (Sample) | 3.0% | 11.0% |
| Standard Deviation (Population) | 3.0% | 10.9% |
Similar Demographics by 4 or more Vehicles in Household
Demographics Similar to Cambodians by 4 or more Vehicles in Household
In terms of 4 or more vehicles in household, the demographic groups most similar to Cambodians are Immigrants from Latvia (5.5%, a difference of 0.010%), Black/African American (5.5%, a difference of 0.12%), Immigrants from Bulgaria (5.5%, a difference of 0.13%), Macedonian (5.5%, a difference of 0.24%), and Immigrants from Kazakhstan (5.5%, a difference of 0.27%).
| Demographics | Rating | Rank | 4 or more Vehicles in Household |
| Colombians | 0.7 /100 | #268 | Tragic 5.5% |
| Carpatho Rusyns | 0.7 /100 | #269 | Tragic 5.5% |
| Okinawans | 0.6 /100 | #270 | Tragic 5.5% |
| Immigrants | Sudan | 0.6 /100 | #271 | Tragic 5.5% |
| Immigrants | Kazakhstan | 0.6 /100 | #272 | Tragic 5.5% |
| Macedonians | 0.6 /100 | #273 | Tragic 5.5% |
| Blacks/African Americans | 0.6 /100 | #274 | Tragic 5.5% |
| Cambodians | 0.5 /100 | #275 | Tragic 5.5% |
| Immigrants | Latvia | 0.5 /100 | #276 | Tragic 5.5% |
| Immigrants | Bulgaria | 0.5 /100 | #277 | Tragic 5.5% |
| Immigrants | Eastern Europe | 0.4 /100 | #278 | Tragic 5.4% |
| Immigrants | Uruguay | 0.3 /100 | #279 | Tragic 5.4% |
| Alsatians | 0.3 /100 | #280 | Tragic 5.4% |
| Immigrants | Western Africa | 0.3 /100 | #281 | Tragic 5.4% |
| Immigrants | Spain | 0.3 /100 | #282 | Tragic 5.4% |
Demographics Similar to Spanish by 4 or more Vehicles in Household
In terms of 4 or more vehicles in household, the demographic groups most similar to Spanish are Pima (7.9%, a difference of 0.57%), Spanish American (8.0%, a difference of 0.63%), Sioux (8.0%, a difference of 0.86%), Scandinavian (8.0%, a difference of 0.89%), and Norwegian (8.0%, a difference of 1.1%).
| Demographics | Rating | Rank | 4 or more Vehicles in Household |
| Yaqui | 100.0 /100 | #33 | Exceptional 8.1% |
| Alaskan Athabascans | 100.0 /100 | #34 | Exceptional 8.1% |
| Guamanians/Chamorros | 100.0 /100 | #35 | Exceptional 8.1% |
| Norwegians | 100.0 /100 | #36 | Exceptional 8.0% |
| Scandinavians | 100.0 /100 | #37 | Exceptional 8.0% |
| Sioux | 100.0 /100 | #38 | Exceptional 8.0% |
| Spanish Americans | 100.0 /100 | #39 | Exceptional 8.0% |
| Spanish | 100.0 /100 | #40 | Exceptional 7.9% |
| Pima | 100.0 /100 | #41 | Exceptional 7.9% |
| Salvadorans | 100.0 /100 | #42 | Exceptional 7.8% |
| Fijians | 100.0 /100 | #43 | Exceptional 7.8% |
| Bhutanese | 100.0 /100 | #44 | Exceptional 7.8% |
| Choctaw | 100.0 /100 | #45 | Exceptional 7.8% |
| Crow | 100.0 /100 | #46 | Exceptional 7.8% |
| Osage | 100.0 /100 | #47 | Exceptional 7.8% |