Immigrants from the Azores vs Guatemalan 2 or more Vehicles in Household
COMPARE
Immigrants from the Azores
Guatemalan
2 or more Vehicles in Household
2 or more Vehicles in Household Comparison
Immigrants from the Azores
Guatemalans
56.4%
2 OR MORE VEHICLES IN HOUSEHOLD
86.6/ 100
METRIC RATING
134th/ 347
METRIC RANK
54.1%
2 OR MORE VEHICLES IN HOUSEHOLD
9.6/ 100
METRIC RATING
213th/ 347
METRIC RANK
Immigrants from the Azores vs Guatemalan 2 or more Vehicles in Household Correlation Chart
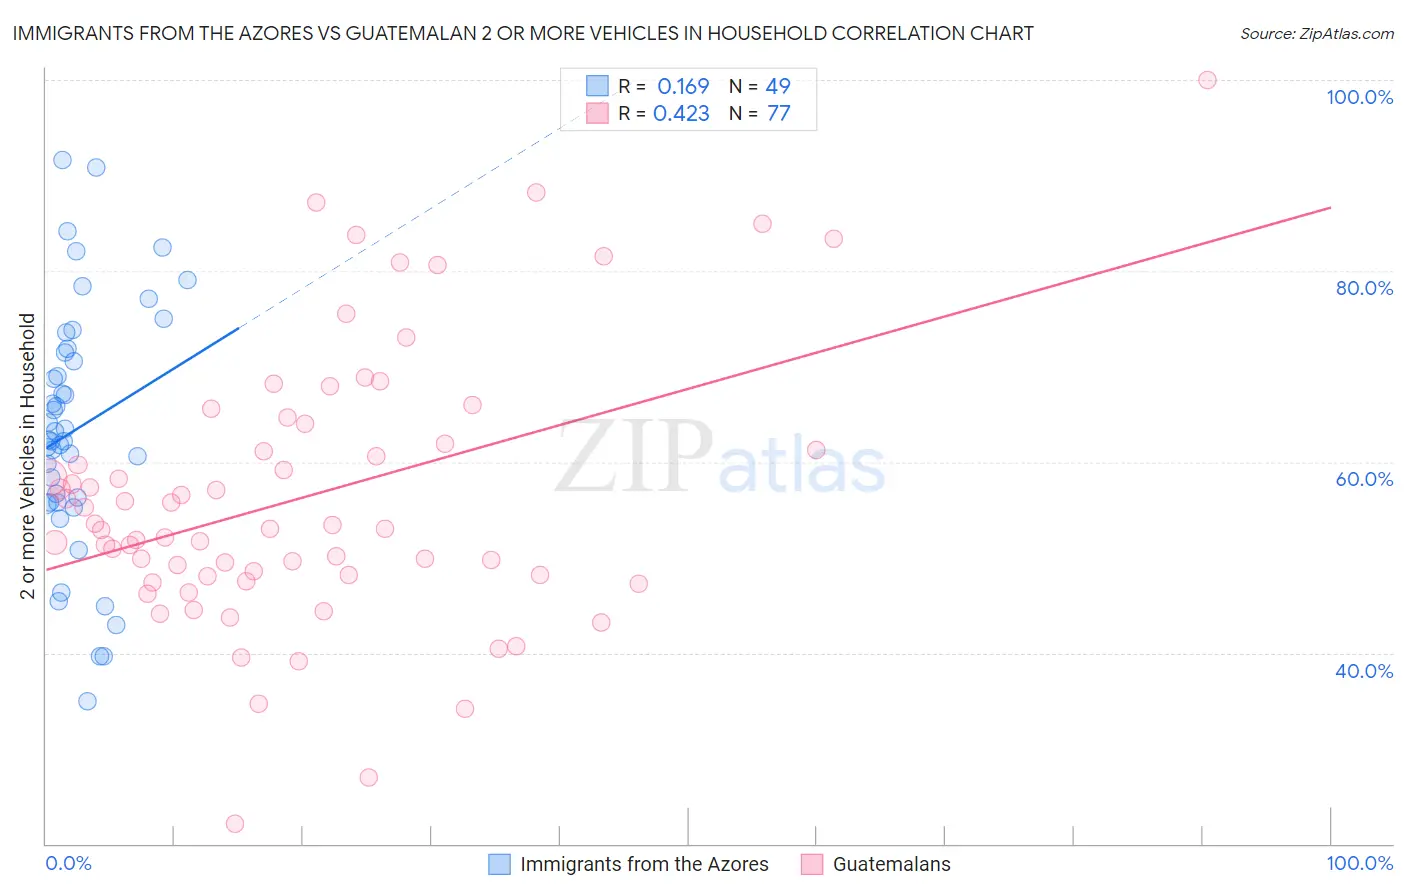
The statistical analysis conducted on geographies consisting of 46,257,310 people shows a poor positive correlation between the proportion of Immigrants from the Azores and percentage of households with 2 or more vehicles available in the United States with a correlation coefficient (R) of 0.169 and weighted average of 56.4%. Similarly, the statistical analysis conducted on geographies consisting of 409,337,767 people shows a moderate positive correlation between the proportion of Guatemalans and percentage of households with 2 or more vehicles available in the United States with a correlation coefficient (R) of 0.423 and weighted average of 54.1%, a difference of 4.2%.
2 or more Vehicles in Household Correlation Summary
| Measurement | Immigrants from the Azores | Guatemalan |
| Minimum | 35.0% | 22.0% |
| Maximum | 91.6% | 100.0% |
| Range | 56.6% | 78.0% |
| Mean | 63.4% | 56.4% |
| Median | 62.3% | 53.1% |
| Interquartile 25% (IQ1) | 55.7% | 48.1% |
| Interquartile 75% (IQ3) | 71.7% | 63.0% |
| Interquartile Range (IQR) | 15.9% | 14.9% |
| Standard Deviation (Sample) | 12.9% | 14.4% |
| Standard Deviation (Population) | 12.7% | 14.3% |
Similar Demographics by 2 or more Vehicles in Household
Demographics Similar to Immigrants from the Azores by 2 or more Vehicles in Household
In terms of 2 or more vehicles in household, the demographic groups most similar to Immigrants from the Azores are Blackfeet (56.4%, a difference of 0.010%), Immigrants from Asia (56.3%, a difference of 0.050%), Cuban (56.3%, a difference of 0.14%), Salvadoran (56.3%, a difference of 0.15%), and Comanche (56.5%, a difference of 0.16%).
| Demographics | Rating | Rank | 2 or more Vehicles in Household |
| Immigrants | Thailand | 90.7 /100 | #127 | Exceptional 56.6% |
| Immigrants | South Central Asia | 90.5 /100 | #128 | Exceptional 56.6% |
| Ute | 90.4 /100 | #129 | Exceptional 56.6% |
| Yugoslavians | 90.0 /100 | #130 | Exceptional 56.6% |
| Bulgarians | 89.7 /100 | #131 | Excellent 56.5% |
| Hungarians | 89.1 /100 | #132 | Excellent 56.5% |
| Comanche | 88.4 /100 | #133 | Excellent 56.5% |
| Immigrants | Azores | 86.6 /100 | #134 | Excellent 56.4% |
| Blackfeet | 86.5 /100 | #135 | Excellent 56.4% |
| Immigrants | Asia | 86.0 /100 | #136 | Excellent 56.3% |
| Cubans | 84.8 /100 | #137 | Excellent 56.3% |
| Salvadorans | 84.7 /100 | #138 | Excellent 56.3% |
| Armenians | 84.3 /100 | #139 | Excellent 56.3% |
| Latvians | 83.6 /100 | #140 | Excellent 56.2% |
| Immigrants | Cambodia | 83.6 /100 | #141 | Excellent 56.2% |
Demographics Similar to Guatemalans by 2 or more Vehicles in Household
In terms of 2 or more vehicles in household, the demographic groups most similar to Guatemalans are Immigrants from Czechoslovakia (54.1%, a difference of 0.020%), Aleut (54.1%, a difference of 0.030%), Immigrants from Western Asia (54.1%, a difference of 0.040%), Immigrants from Chile (54.2%, a difference of 0.16%), and Immigrants from Saudi Arabia (54.2%, a difference of 0.19%).
| Demographics | Rating | Rank | 2 or more Vehicles in Household |
| Immigrants | Latin America | 13.1 /100 | #206 | Poor 54.3% |
| Turks | 13.0 /100 | #207 | Poor 54.3% |
| Egyptians | 12.0 /100 | #208 | Poor 54.3% |
| Immigrants | Bulgaria | 12.0 /100 | #209 | Poor 54.3% |
| Immigrants | Saudi Arabia | 11.3 /100 | #210 | Poor 54.2% |
| Immigrants | Hungary | 11.3 /100 | #211 | Poor 54.2% |
| Immigrants | Chile | 11.1 /100 | #212 | Poor 54.2% |
| Guatemalans | 9.6 /100 | #213 | Tragic 54.1% |
| Immigrants | Czechoslovakia | 9.4 /100 | #214 | Tragic 54.1% |
| Aleuts | 9.3 /100 | #215 | Tragic 54.1% |
| Immigrants | Western Asia | 9.3 /100 | #216 | Tragic 54.1% |
| Immigrants | Burma/Myanmar | 7.1 /100 | #217 | Tragic 53.9% |
| Immigrants | Argentina | 6.8 /100 | #218 | Tragic 53.9% |
| South American Indians | 6.5 /100 | #219 | Tragic 53.9% |
| Taiwanese | 6.3 /100 | #220 | Tragic 53.9% |