Immigrants from the Azores vs Guatemalan Median Female Earnings
COMPARE
Immigrants from the Azores
Guatemalan
Median Female Earnings
Median Female Earnings Comparison
Immigrants from the Azores
Guatemalans
$38,573
MEDIAN FEMALE EARNINGS
8.8/ 100
METRIC RATING
221st/ 347
METRIC RANK
$35,695
MEDIAN FEMALE EARNINGS
0.0/ 100
METRIC RATING
293rd/ 347
METRIC RANK
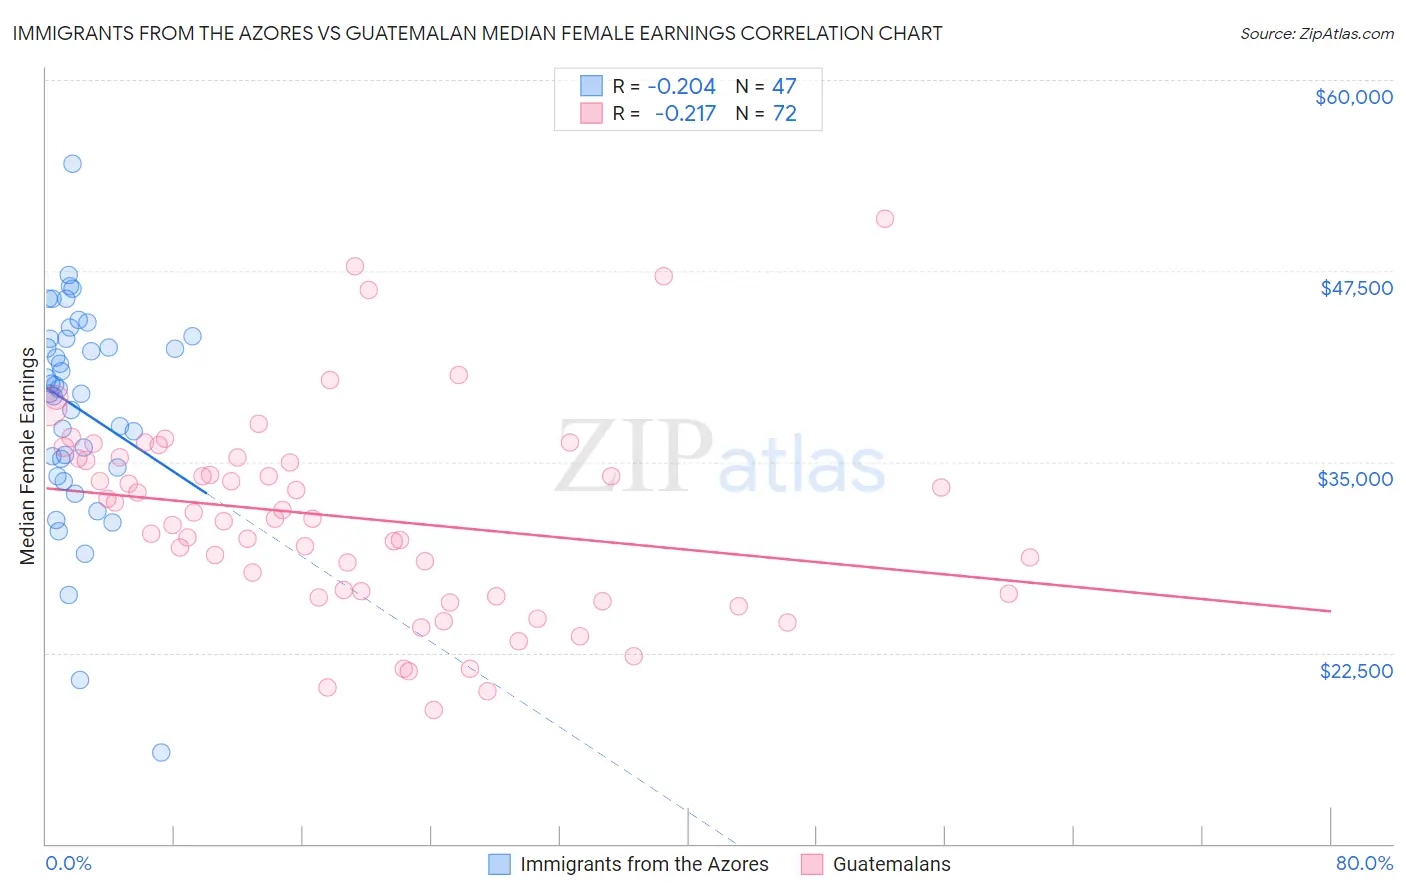
Immigrants from the Azores vs Guatemalan Median Female Earnings Correlation Chart
The statistical analysis conducted on geographies consisting of 46,252,710 people shows a weak negative correlation between the proportion of Immigrants from the Azores and median female earnings in the United States with a correlation coefficient (R) of -0.204 and weighted average of $38,573. Similarly, the statistical analysis conducted on geographies consisting of 409,414,975 people shows a weak negative correlation between the proportion of Guatemalans and median female earnings in the United States with a correlation coefficient (R) of -0.217 and weighted average of $35,695, a difference of 8.1%.
Median Female Earnings Correlation Summary
| Measurement | Immigrants from the Azores | Guatemalan |
| Minimum | $15,996 | $18,750 |
| Maximum | $54,521 | $50,917 |
| Range | $38,525 | $32,167 |
| Mean | $38,490 | $31,367 |
| Median | $39,828 | $31,263 |
| Interquartile 25% (IQ1) | $34,594 | $26,284 |
| Interquartile 75% (IQ3) | $43,084 | $35,245 |
| Interquartile Range (IQR) | $8,490 | $8,961 |
| Standard Deviation (Sample) | $7,045 | $6,641 |
| Standard Deviation (Population) | $6,970 | $6,594 |
Similar Demographics by Median Female Earnings
Demographics Similar to Immigrants from the Azores by Median Female Earnings
In terms of median female earnings, the demographic groups most similar to Immigrants from the Azores are Yugoslavian ($38,573, a difference of 0.0%), Nepalese ($38,603, a difference of 0.080%), Cape Verdean ($38,614, a difference of 0.11%), Japanese ($38,528, a difference of 0.12%), and Immigrants from Jamaica ($38,625, a difference of 0.14%).
| Demographics | Rating | Rank | Median Female Earnings |
| Iraqis | 10.5 /100 | #214 | Poor $38,666 |
| Spaniards | 10.3 /100 | #215 | Poor $38,656 |
| Immigrants | Ecuador | 10.1 /100 | #216 | Poor $38,644 |
| Immigrants | Jamaica | 9.7 /100 | #217 | Tragic $38,625 |
| Cape Verdeans | 9.5 /100 | #218 | Tragic $38,614 |
| Nepalese | 9.3 /100 | #219 | Tragic $38,603 |
| Yugoslavians | 8.8 /100 | #220 | Tragic $38,573 |
| Immigrants | Azores | 8.8 /100 | #221 | Tragic $38,573 |
| Japanese | 8.1 /100 | #222 | Tragic $38,528 |
| Immigrants | Sudan | 7.8 /100 | #223 | Tragic $38,511 |
| Native Hawaiians | 7.1 /100 | #224 | Tragic $38,461 |
| French | 7.0 /100 | #225 | Tragic $38,457 |
| French Canadians | 6.8 /100 | #226 | Tragic $38,436 |
| Scottish | 6.3 /100 | #227 | Tragic $38,397 |
| Sub-Saharan Africans | 6.2 /100 | #228 | Tragic $38,391 |
Demographics Similar to Guatemalans by Median Female Earnings
In terms of median female earnings, the demographic groups most similar to Guatemalans are Cheyenne ($35,673, a difference of 0.060%), Comanche ($35,661, a difference of 0.090%), Mexican American Indian ($35,629, a difference of 0.19%), American ($35,777, a difference of 0.23%), and Blackfeet ($35,864, a difference of 0.47%).
| Demographics | Rating | Rank | Median Female Earnings |
| Osage | 0.0 /100 | #286 | Tragic $36,034 |
| Immigrants | Nicaragua | 0.0 /100 | #287 | Tragic $36,023 |
| Immigrants | Zaire | 0.0 /100 | #288 | Tragic $36,017 |
| Bangladeshis | 0.0 /100 | #289 | Tragic $35,960 |
| Central American Indians | 0.0 /100 | #290 | Tragic $35,930 |
| Blackfeet | 0.0 /100 | #291 | Tragic $35,864 |
| Americans | 0.0 /100 | #292 | Tragic $35,777 |
| Guatemalans | 0.0 /100 | #293 | Tragic $35,695 |
| Cheyenne | 0.0 /100 | #294 | Tragic $35,673 |
| Comanche | 0.0 /100 | #295 | Tragic $35,661 |
| Mexican American Indians | 0.0 /100 | #296 | Tragic $35,629 |
| Hmong | 0.0 /100 | #297 | Tragic $35,498 |
| Immigrants | Micronesia | 0.0 /100 | #298 | Tragic $35,477 |
| Immigrants | Guatemala | 0.0 /100 | #299 | Tragic $35,444 |
| Yuman | 0.0 /100 | #300 | Tragic $35,377 |