Immigrants from the Azores vs Guatemalan Master's Degree
COMPARE
Immigrants from the Azores
Guatemalan
Master's Degree
Master's Degree Comparison
Immigrants from the Azores
Guatemalans
10.2%
MASTER'S DEGREE
0.0/ 100
METRIC RATING
332nd/ 347
METRIC RANK
11.7%
MASTER'S DEGREE
0.1/ 100
METRIC RATING
289th/ 347
METRIC RANK
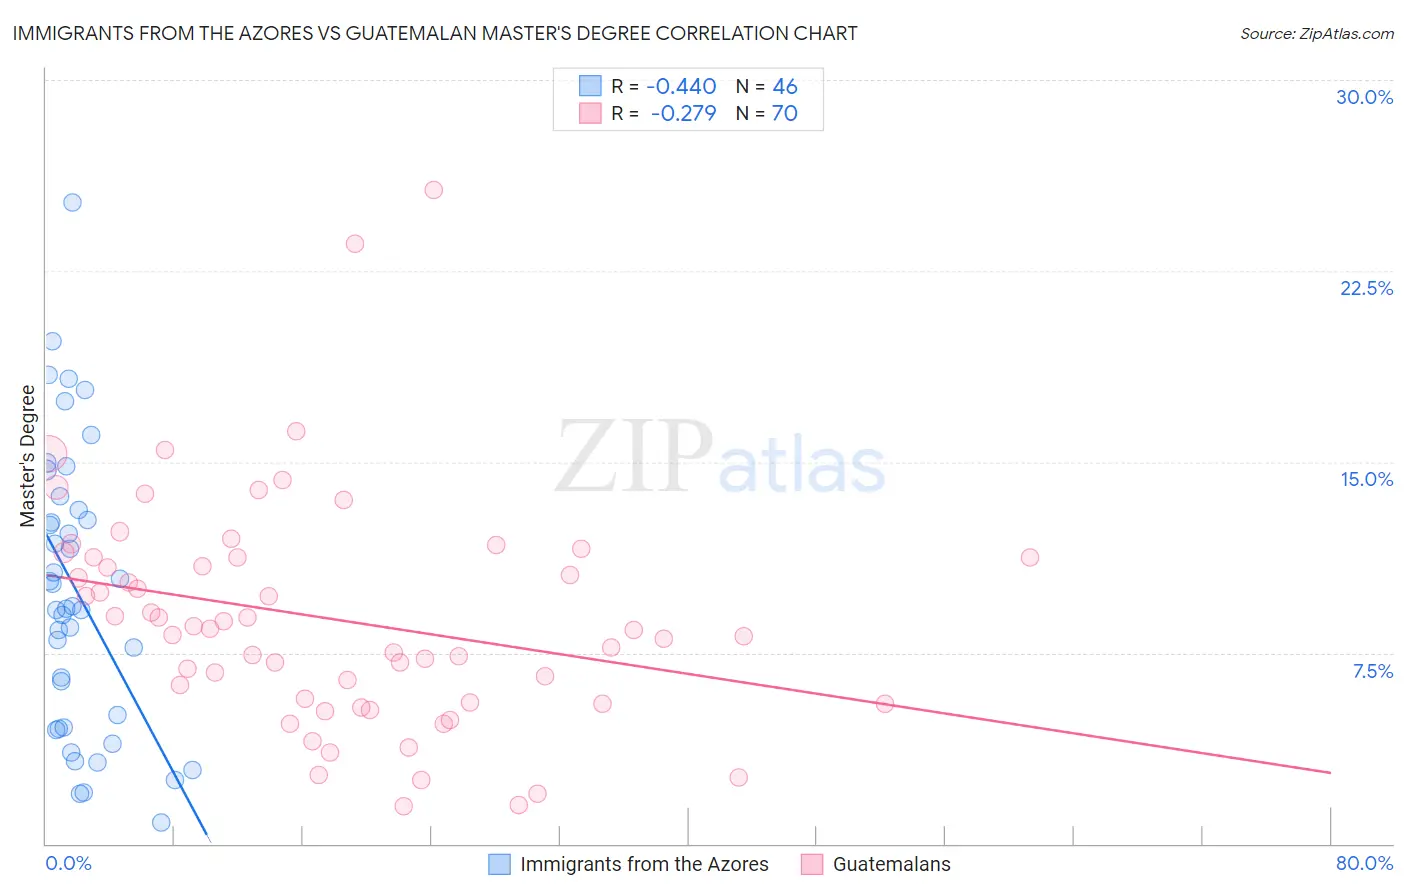
Immigrants from the Azores vs Guatemalan Master's Degree Correlation Chart
The statistical analysis conducted on geographies consisting of 46,256,023 people shows a moderate negative correlation between the proportion of Immigrants from the Azores and percentage of population with at least master's degree education in the United States with a correlation coefficient (R) of -0.440 and weighted average of 10.2%. Similarly, the statistical analysis conducted on geographies consisting of 409,354,875 people shows a weak negative correlation between the proportion of Guatemalans and percentage of population with at least master's degree education in the United States with a correlation coefficient (R) of -0.279 and weighted average of 11.7%, a difference of 14.8%.
Master's Degree Correlation Summary
| Measurement | Immigrants from the Azores | Guatemalan |
| Minimum | 0.81% | 1.5% |
| Maximum | 25.2% | 25.7% |
| Range | 24.4% | 24.2% |
| Mean | 9.9% | 8.8% |
| Median | 9.3% | 8.4% |
| Interquartile 25% (IQ1) | 4.6% | 5.5% |
| Interquartile 75% (IQ3) | 13.1% | 11.2% |
| Interquartile Range (IQR) | 8.5% | 5.7% |
| Standard Deviation (Sample) | 5.6% | 4.5% |
| Standard Deviation (Population) | 5.5% | 4.4% |
Similar Demographics by Master's Degree
Demographics Similar to Immigrants from the Azores by Master's Degree
In terms of master's degree, the demographic groups most similar to Immigrants from the Azores are Menominee (10.2%, a difference of 0.37%), Pueblo (10.3%, a difference of 0.46%), Fijian (10.3%, a difference of 0.63%), Arapaho (10.0%, a difference of 2.3%), and Nepalese (10.5%, a difference of 2.4%).
| Demographics | Rating | Rank | Master's Degree |
| Inupiat | 0.0 /100 | #325 | Tragic 10.5% |
| Creek | 0.0 /100 | #326 | Tragic 10.5% |
| Paiute | 0.0 /100 | #327 | Tragic 10.5% |
| Bangladeshis | 0.0 /100 | #328 | Tragic 10.5% |
| Nepalese | 0.0 /100 | #329 | Tragic 10.5% |
| Fijians | 0.0 /100 | #330 | Tragic 10.3% |
| Pueblo | 0.0 /100 | #331 | Tragic 10.3% |
| Immigrants | Azores | 0.0 /100 | #332 | Tragic 10.2% |
| Menominee | 0.0 /100 | #333 | Tragic 10.2% |
| Arapaho | 0.0 /100 | #334 | Tragic 10.0% |
| Immigrants | Central America | 0.0 /100 | #335 | Tragic 10.0% |
| Natives/Alaskans | 0.0 /100 | #336 | Tragic 9.9% |
| Mexicans | 0.0 /100 | #337 | Tragic 9.7% |
| Tohono O'odham | 0.0 /100 | #338 | Tragic 9.7% |
| Spanish American Indians | 0.0 /100 | #339 | Tragic 9.6% |
Demographics Similar to Guatemalans by Master's Degree
In terms of master's degree, the demographic groups most similar to Guatemalans are Immigrants from Honduras (11.8%, a difference of 0.080%), Ute (11.7%, a difference of 0.24%), Immigrants from Haiti (11.8%, a difference of 0.25%), Aleut (11.8%, a difference of 0.44%), and Immigrants from Nicaragua (11.8%, a difference of 0.80%).
| Demographics | Rating | Rank | Master's Degree |
| Immigrants | El Salvador | 0.2 /100 | #282 | Tragic 12.0% |
| Hondurans | 0.2 /100 | #283 | Tragic 11.9% |
| Ottawa | 0.2 /100 | #284 | Tragic 11.9% |
| Immigrants | Nicaragua | 0.2 /100 | #285 | Tragic 11.8% |
| Aleuts | 0.1 /100 | #286 | Tragic 11.8% |
| Immigrants | Haiti | 0.1 /100 | #287 | Tragic 11.8% |
| Immigrants | Honduras | 0.1 /100 | #288 | Tragic 11.8% |
| Guatemalans | 0.1 /100 | #289 | Tragic 11.7% |
| Ute | 0.1 /100 | #290 | Tragic 11.7% |
| Colville | 0.1 /100 | #291 | Tragic 11.6% |
| Immigrants | Guatemala | 0.1 /100 | #292 | Tragic 11.6% |
| Alaska Natives | 0.1 /100 | #293 | Tragic 11.6% |
| Hawaiians | 0.1 /100 | #294 | Tragic 11.6% |
| Marshallese | 0.1 /100 | #295 | Tragic 11.6% |
| Alaskan Athabascans | 0.1 /100 | #296 | Tragic 11.6% |