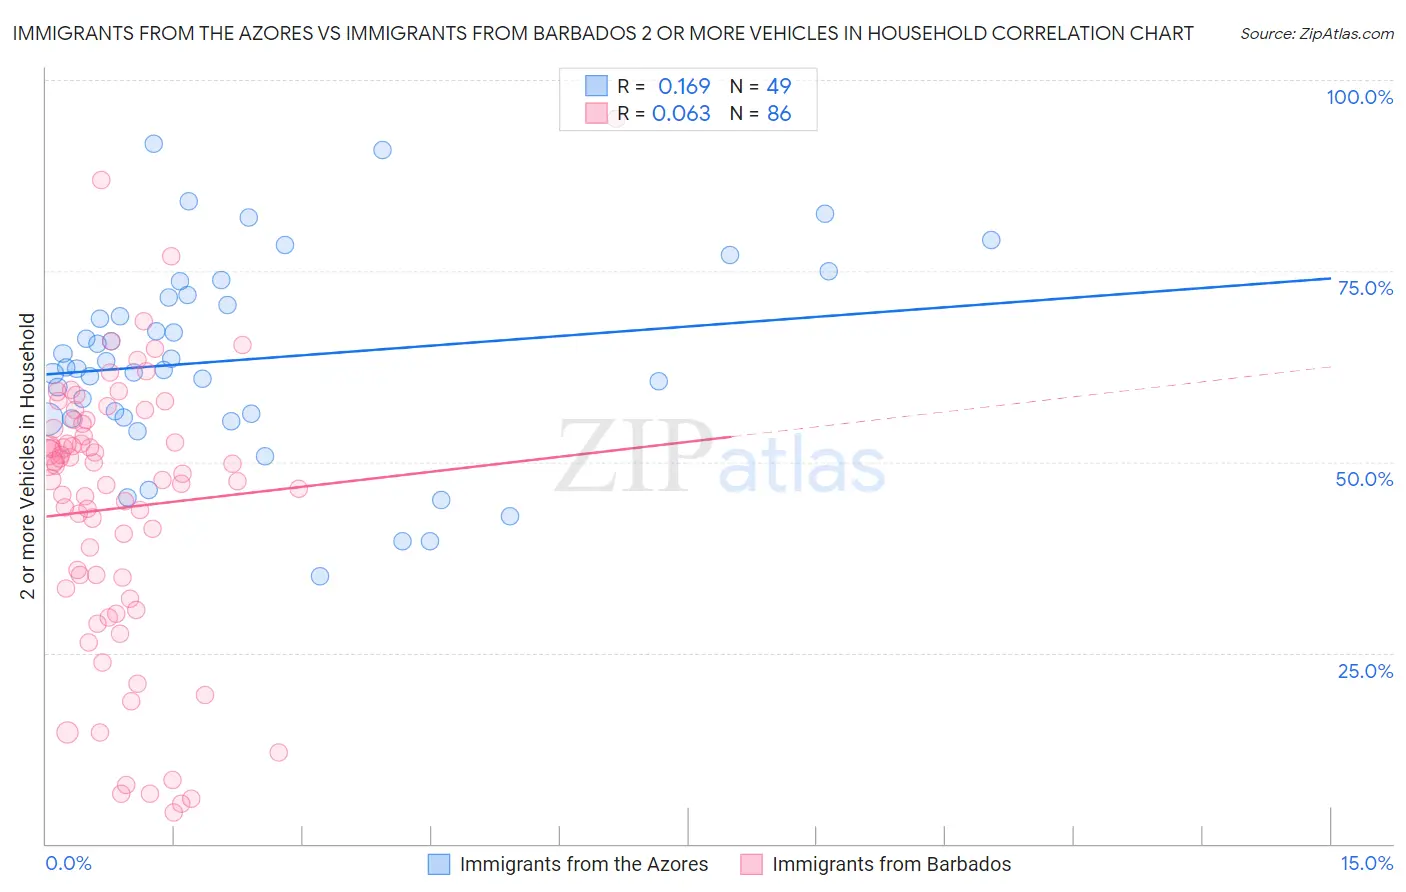
Immigrants from the Azores vs Immigrants from Barbados 2 or more Vehicles in Household
COMPARE
Immigrants from the Azores
Immigrants from Barbados
2 or more Vehicles in Household
2 or more Vehicles in Household Comparison
Immigrants from the Azores
Immigrants from Barbados
56.4%
2 OR MORE VEHICLES IN HOUSEHOLD
86.6/ 100
METRIC RATING
134th/ 347
METRIC RANK
35.8%
2 OR MORE VEHICLES IN HOUSEHOLD
0.0/ 100
METRIC RATING
339th/ 347
METRIC RANK
Immigrants from the Azores vs Immigrants from Barbados 2 or more Vehicles in Household Correlation Chart
The statistical analysis conducted on geographies consisting of 46,257,310 people shows a poor positive correlation between the proportion of Immigrants from the Azores and percentage of households with 2 or more vehicles available in the United States with a correlation coefficient (R) of 0.169 and weighted average of 56.4%. Similarly, the statistical analysis conducted on geographies consisting of 112,774,153 people shows a slight positive correlation between the proportion of Immigrants from Barbados and percentage of households with 2 or more vehicles available in the United States with a correlation coefficient (R) of 0.063 and weighted average of 35.8%, a difference of 57.5%.
2 or more Vehicles in Household Correlation Summary
| Measurement | Immigrants from the Azores | Immigrants from Barbados |
| Minimum | 35.0% | 4.2% |
| Maximum | 91.6% | 94.9% |
| Range | 56.6% | 90.7% |
| Mean | 63.4% | 44.0% |
| Median | 62.3% | 48.0% |
| Interquartile 25% (IQ1) | 55.7% | 33.4% |
| Interquartile 75% (IQ3) | 71.7% | 55.1% |
| Interquartile Range (IQR) | 15.9% | 21.6% |
| Standard Deviation (Sample) | 12.9% | 18.4% |
| Standard Deviation (Population) | 12.7% | 18.3% |
Similar Demographics by 2 or more Vehicles in Household
Demographics Similar to Immigrants from the Azores by 2 or more Vehicles in Household
In terms of 2 or more vehicles in household, the demographic groups most similar to Immigrants from the Azores are Blackfeet (56.4%, a difference of 0.010%), Immigrants from Asia (56.3%, a difference of 0.050%), Cuban (56.3%, a difference of 0.14%), Salvadoran (56.3%, a difference of 0.15%), and Comanche (56.5%, a difference of 0.16%).
| Demographics | Rating | Rank | 2 or more Vehicles in Household |
| Immigrants | Thailand | 90.7 /100 | #127 | Exceptional 56.6% |
| Immigrants | South Central Asia | 90.5 /100 | #128 | Exceptional 56.6% |
| Ute | 90.4 /100 | #129 | Exceptional 56.6% |
| Yugoslavians | 90.0 /100 | #130 | Exceptional 56.6% |
| Bulgarians | 89.7 /100 | #131 | Excellent 56.5% |
| Hungarians | 89.1 /100 | #132 | Excellent 56.5% |
| Comanche | 88.4 /100 | #133 | Excellent 56.5% |
| Immigrants | Azores | 86.6 /100 | #134 | Excellent 56.4% |
| Blackfeet | 86.5 /100 | #135 | Excellent 56.4% |
| Immigrants | Asia | 86.0 /100 | #136 | Excellent 56.3% |
| Cubans | 84.8 /100 | #137 | Excellent 56.3% |
| Salvadorans | 84.7 /100 | #138 | Excellent 56.3% |
| Armenians | 84.3 /100 | #139 | Excellent 56.3% |
| Latvians | 83.6 /100 | #140 | Excellent 56.2% |
| Immigrants | Cambodia | 83.6 /100 | #141 | Excellent 56.2% |
Demographics Similar to Immigrants from Barbados by 2 or more Vehicles in Household
In terms of 2 or more vehicles in household, the demographic groups most similar to Immigrants from Barbados are British West Indian (35.4%, a difference of 1.1%), Guyanese (35.4%, a difference of 1.1%), Dominican (35.3%, a difference of 1.3%), Immigrants from Guyana (35.0%, a difference of 2.2%), and Yup'ik (34.9%, a difference of 2.4%).
| Demographics | Rating | Rank | 2 or more Vehicles in Household |
| Trinidadians and Tobagonians | 0.0 /100 | #332 | Tragic 40.9% |
| Immigrants | Ecuador | 0.0 /100 | #333 | Tragic 40.5% |
| Immigrants | Trinidad and Tobago | 0.0 /100 | #334 | Tragic 40.3% |
| Immigrants | Bangladesh | 0.0 /100 | #335 | Tragic 38.8% |
| Vietnamese | 0.0 /100 | #336 | Tragic 38.5% |
| Barbadians | 0.0 /100 | #337 | Tragic 38.3% |
| Immigrants | Uzbekistan | 0.0 /100 | #338 | Tragic 37.9% |
| Immigrants | Barbados | 0.0 /100 | #339 | Tragic 35.8% |
| British West Indians | 0.0 /100 | #340 | Tragic 35.4% |
| Guyanese | 0.0 /100 | #341 | Tragic 35.4% |
| Dominicans | 0.0 /100 | #342 | Tragic 35.3% |
| Immigrants | Guyana | 0.0 /100 | #343 | Tragic 35.0% |
| Yup'ik | 0.0 /100 | #344 | Tragic 34.9% |
| Immigrants | Dominican Republic | 0.0 /100 | #345 | Tragic 33.2% |
| Immigrants | St. Vincent and the Grenadines | 0.0 /100 | #346 | Tragic 31.0% |