Immigrants from Austria vs Chinese 2 or more Vehicles in Household
COMPARE
Immigrants from Austria
Chinese
2 or more Vehicles in Household
2 or more Vehicles in Household Comparison
Immigrants from Austria
Chinese
55.5%
2 OR MORE VEHICLES IN HOUSEHOLD
56.3/ 100
METRIC RATING
169th/ 347
METRIC RANK
60.1%
2 OR MORE VEHICLES IN HOUSEHOLD
100.0/ 100
METRIC RATING
36th/ 347
METRIC RANK
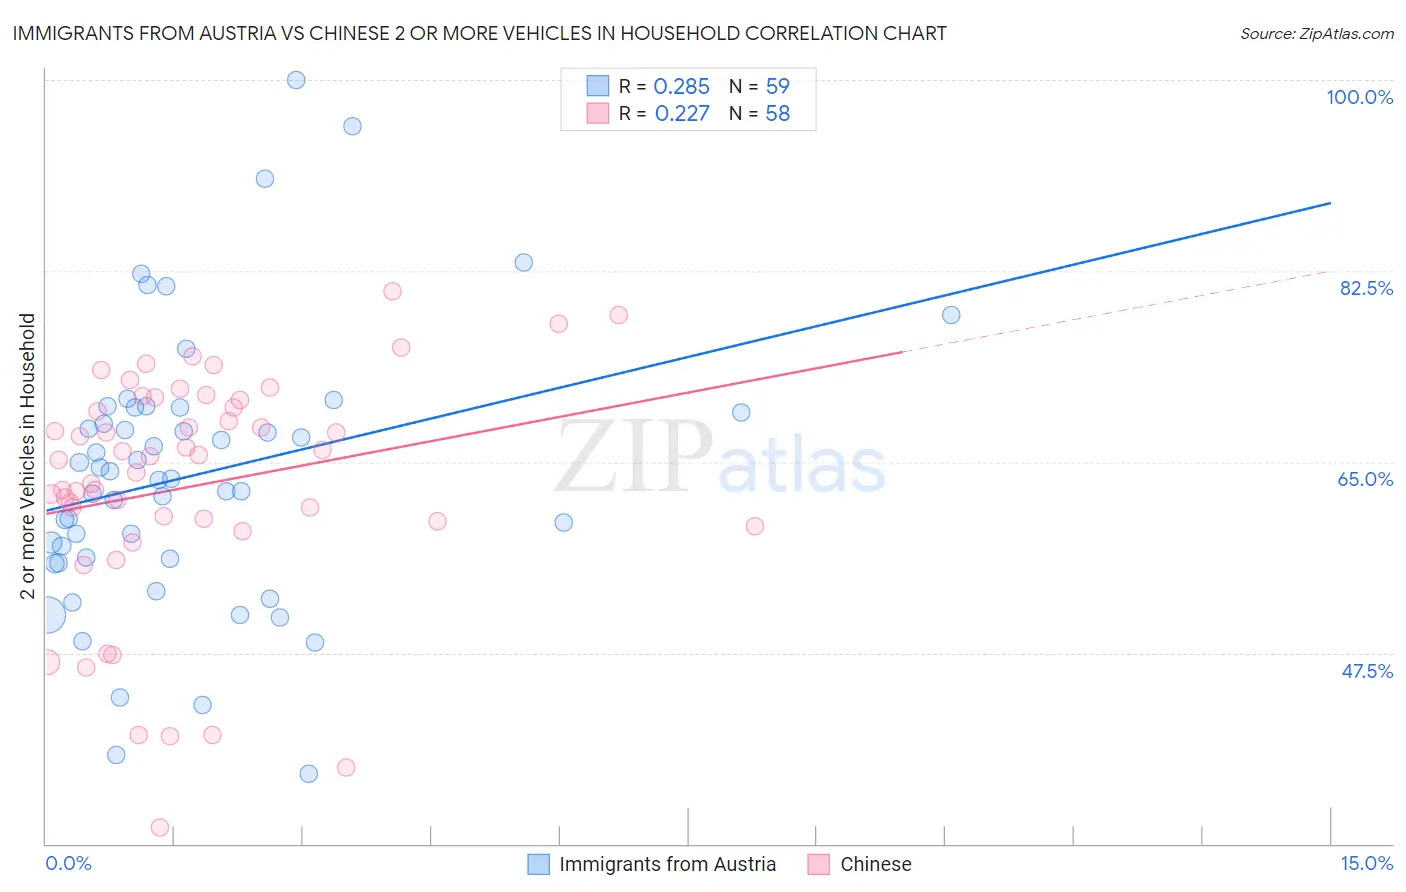
Immigrants from Austria vs Chinese 2 or more Vehicles in Household Correlation Chart
The statistical analysis conducted on geographies consisting of 167,963,508 people shows a weak positive correlation between the proportion of Immigrants from Austria and percentage of households with 2 or more vehicles available in the United States with a correlation coefficient (R) of 0.285 and weighted average of 55.5%. Similarly, the statistical analysis conducted on geographies consisting of 64,802,428 people shows a weak positive correlation between the proportion of Chinese and percentage of households with 2 or more vehicles available in the United States with a correlation coefficient (R) of 0.227 and weighted average of 60.1%, a difference of 8.3%.
2 or more Vehicles in Household Correlation Summary
| Measurement | Immigrants from Austria | Chinese |
| Minimum | 36.4% | 31.5% |
| Maximum | 100.0% | 80.6% |
| Range | 63.6% | 49.2% |
| Mean | 63.8% | 62.8% |
| Median | 63.4% | 65.3% |
| Interquartile 25% (IQ1) | 56.1% | 59.5% |
| Interquartile 75% (IQ3) | 70.0% | 70.6% |
| Interquartile Range (IQR) | 13.9% | 11.1% |
| Standard Deviation (Sample) | 12.6% | 10.9% |
| Standard Deviation (Population) | 12.5% | 10.8% |
Similar Demographics by 2 or more Vehicles in Household
Demographics Similar to Immigrants from Austria by 2 or more Vehicles in Household
In terms of 2 or more vehicles in household, the demographic groups most similar to Immigrants from Austria are French American Indian (55.5%, a difference of 0.010%), Romanian (55.5%, a difference of 0.020%), Kenyan (55.5%, a difference of 0.070%), Immigrants from Sri Lanka (55.5%, a difference of 0.080%), and Immigrants from Costa Rica (55.4%, a difference of 0.080%).
| Demographics | Rating | Rank | 2 or more Vehicles in Household |
| German Russians | 60.9 /100 | #162 | Good 55.6% |
| Immigrants | Zimbabwe | 60.2 /100 | #163 | Good 55.6% |
| Dutch West Indians | 59.8 /100 | #164 | Average 55.6% |
| Immigrants | El Salvador | 59.4 /100 | #165 | Average 55.6% |
| Immigrants | Sri Lanka | 58.3 /100 | #166 | Average 55.5% |
| Kenyans | 58.1 /100 | #167 | Average 55.5% |
| French American Indians | 56.7 /100 | #168 | Average 55.5% |
| Immigrants | Austria | 56.3 /100 | #169 | Average 55.5% |
| Romanians | 55.8 /100 | #170 | Average 55.5% |
| Immigrants | Costa Rica | 54.4 /100 | #171 | Average 55.4% |
| Immigrants | Nicaragua | 51.6 /100 | #172 | Average 55.4% |
| Immigrants | Western Europe | 51.4 /100 | #173 | Average 55.4% |
| Navajo | 50.0 /100 | #174 | Average 55.3% |
| Immigrants | Denmark | 49.4 /100 | #175 | Average 55.3% |
| Immigrants | Cuba | 47.0 /100 | #176 | Average 55.3% |
Demographics Similar to Chinese by 2 or more Vehicles in Household
In terms of 2 or more vehicles in household, the demographic groups most similar to Chinese are Immigrants from Philippines (60.1%, a difference of 0.020%), Irish (60.1%, a difference of 0.030%), American (60.0%, a difference of 0.10%), British (60.0%, a difference of 0.10%), and Spanish (60.2%, a difference of 0.14%).
| Demographics | Rating | Rank | 2 or more Vehicles in Household |
| Hawaiians | 100.0 /100 | #29 | Exceptional 60.4% |
| Finns | 100.0 /100 | #30 | Exceptional 60.3% |
| Spanish American Indians | 100.0 /100 | #31 | Exceptional 60.3% |
| Arapaho | 100.0 /100 | #32 | Exceptional 60.2% |
| Immigrants | Mexico | 100.0 /100 | #33 | Exceptional 60.2% |
| Spanish | 100.0 /100 | #34 | Exceptional 60.2% |
| Immigrants | Philippines | 100.0 /100 | #35 | Exceptional 60.1% |
| Chinese | 100.0 /100 | #36 | Exceptional 60.1% |
| Irish | 100.0 /100 | #37 | Exceptional 60.1% |
| Americans | 100.0 /100 | #38 | Exceptional 60.0% |
| British | 100.0 /100 | #39 | Exceptional 60.0% |
| Cherokee | 100.0 /100 | #40 | Exceptional 59.9% |
| Northern Europeans | 100.0 /100 | #41 | Exceptional 59.9% |
| Malaysians | 100.0 /100 | #42 | Exceptional 59.8% |
| Czechoslovakians | 100.0 /100 | #43 | Exceptional 59.8% |