Bermudan vs Immigrants from Singapore 1 or more Vehicles in Household
COMPARE
Bermudan
Immigrants from Singapore
1 or more Vehicles in Household
1 or more Vehicles in Household Comparison
Bermudans
Immigrants from Singapore
87.5%
1 OR MORE VEHICLES IN HOUSEHOLD
0.2/ 100
METRIC RATING
271st/ 347
METRIC RANK
87.2%
1 OR MORE VEHICLES IN HOUSEHOLD
0.1/ 100
METRIC RATING
275th/ 347
METRIC RANK
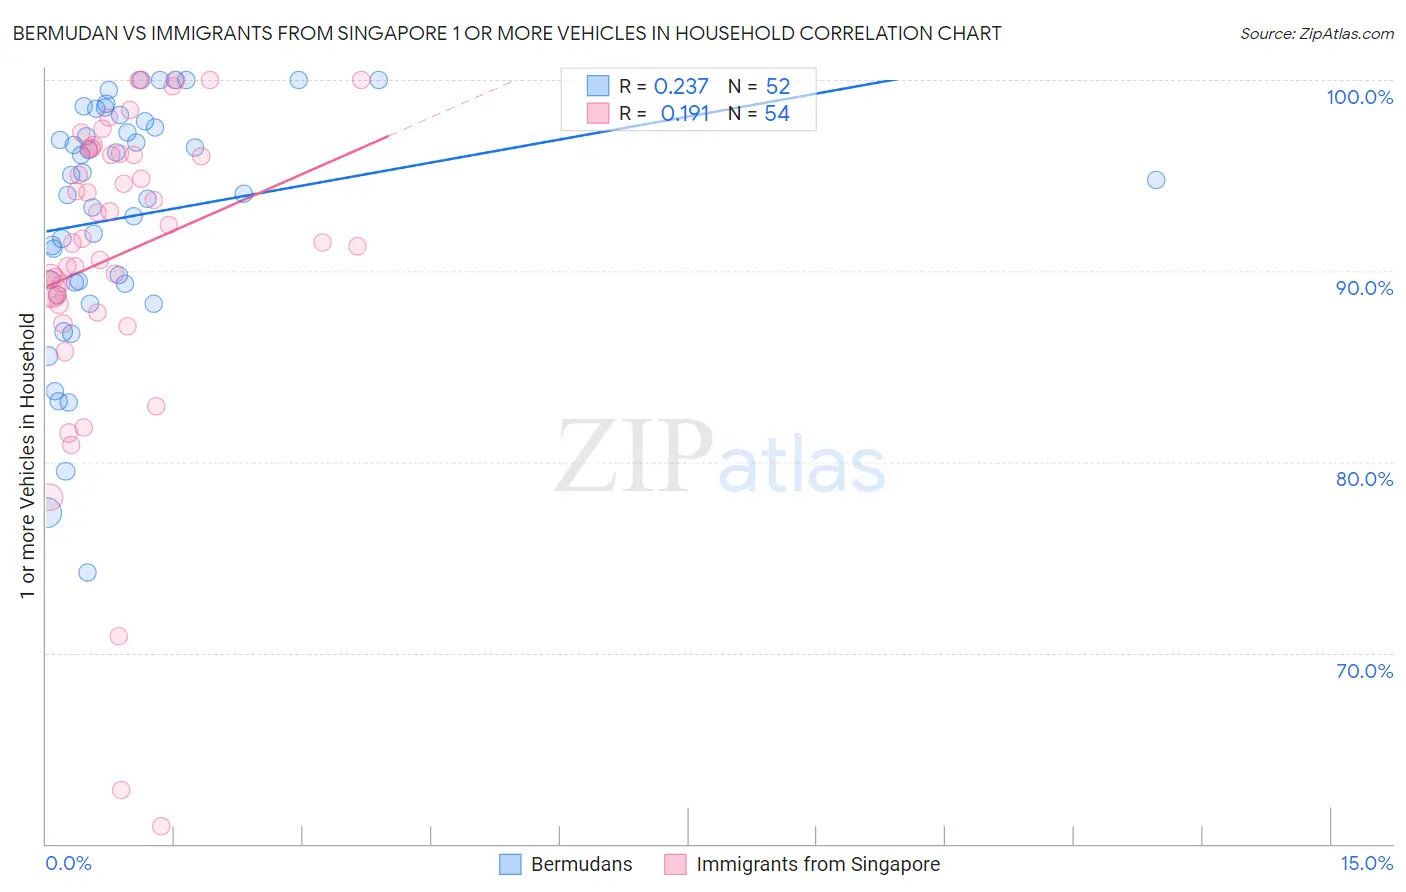
Bermudan vs Immigrants from Singapore 1 or more Vehicles in Household Correlation Chart
The statistical analysis conducted on geographies consisting of 55,645,042 people shows a weak positive correlation between the proportion of Bermudans and percentage of households with 1 or more vehicles available in the United States with a correlation coefficient (R) of 0.237 and weighted average of 87.5%. Similarly, the statistical analysis conducted on geographies consisting of 137,467,600 people shows a poor positive correlation between the proportion of Immigrants from Singapore and percentage of households with 1 or more vehicles available in the United States with a correlation coefficient (R) of 0.191 and weighted average of 87.2%, a difference of 0.38%.
1 or more Vehicles in Household Correlation Summary
| Measurement | Bermudan | Immigrants from Singapore |
| Minimum | 74.2% | 60.9% |
| Maximum | 100.0% | 100.0% |
| Range | 25.8% | 39.1% |
| Mean | 92.9% | 90.8% |
| Median | 94.4% | 92.0% |
| Interquartile 25% (IQ1) | 89.4% | 88.6% |
| Interquartile 75% (IQ3) | 97.7% | 96.4% |
| Interquartile Range (IQR) | 8.3% | 7.8% |
| Standard Deviation (Sample) | 6.2% | 8.3% |
| Standard Deviation (Population) | 6.2% | 8.3% |
Demographics Similar to Bermudans and Immigrants from Singapore by 1 or more Vehicles in Household
In terms of 1 or more vehicles in household, the demographic groups most similar to Bermudans are Panamanian (87.5%, a difference of 0.010%), Immigrants from Africa (87.6%, a difference of 0.020%), Aleut (87.5%, a difference of 0.060%), Immigrants from Europe (87.6%, a difference of 0.070%), and Immigrants from Colombia (87.6%, a difference of 0.10%). Similarly, the demographic groups most similar to Immigrants from Singapore are Immigrants from France (87.1%, a difference of 0.070%), Alsatian (87.1%, a difference of 0.13%), Immigrants from Southern Europe (87.1%, a difference of 0.17%), Immigrants from Albania (87.1%, a difference of 0.17%), and Immigrants from Croatia (87.0%, a difference of 0.20%).
| Demographics | Rating | Rank | 1 or more Vehicles in Household |
| Immigrants | Egypt | 0.5 /100 | #263 | Tragic 87.8% |
| Immigrants | Liberia | 0.4 /100 | #264 | Tragic 87.8% |
| Africans | 0.4 /100 | #265 | Tragic 87.8% |
| Israelis | 0.3 /100 | #266 | Tragic 87.7% |
| Immigrants | Colombia | 0.3 /100 | #267 | Tragic 87.6% |
| Immigrants | Europe | 0.2 /100 | #268 | Tragic 87.6% |
| Immigrants | Africa | 0.2 /100 | #269 | Tragic 87.6% |
| Panamanians | 0.2 /100 | #270 | Tragic 87.5% |
| Bermudans | 0.2 /100 | #271 | Tragic 87.5% |
| Aleuts | 0.2 /100 | #272 | Tragic 87.5% |
| Immigrants | Northern Africa | 0.2 /100 | #273 | Tragic 87.4% |
| Immigrants | Morocco | 0.1 /100 | #274 | Tragic 87.4% |
| Immigrants | Singapore | 0.1 /100 | #275 | Tragic 87.2% |
| Immigrants | France | 0.1 /100 | #276 | Tragic 87.1% |
| Alsatians | 0.1 /100 | #277 | Tragic 87.1% |
| Immigrants | Southern Europe | 0.1 /100 | #278 | Tragic 87.1% |
| Immigrants | Albania | 0.1 /100 | #279 | Tragic 87.1% |
| Immigrants | Croatia | 0.0 /100 | #280 | Tragic 87.0% |
| Mongolians | 0.0 /100 | #281 | Tragic 87.0% |
| Colville | 0.0 /100 | #282 | Tragic 86.8% |
| Immigrants | Eastern Europe | 0.0 /100 | #283 | Tragic 86.7% |