Hungarian vs Immigrants from Singapore 1 or more Vehicles in Household
COMPARE
Hungarian
Immigrants from Singapore
1 or more Vehicles in Household
1 or more Vehicles in Household Comparison
Hungarians
Immigrants from Singapore
90.3%
1 OR MORE VEHICLES IN HOUSEHOLD
86.5/ 100
METRIC RATING
136th/ 347
METRIC RANK
87.2%
1 OR MORE VEHICLES IN HOUSEHOLD
0.1/ 100
METRIC RATING
275th/ 347
METRIC RANK
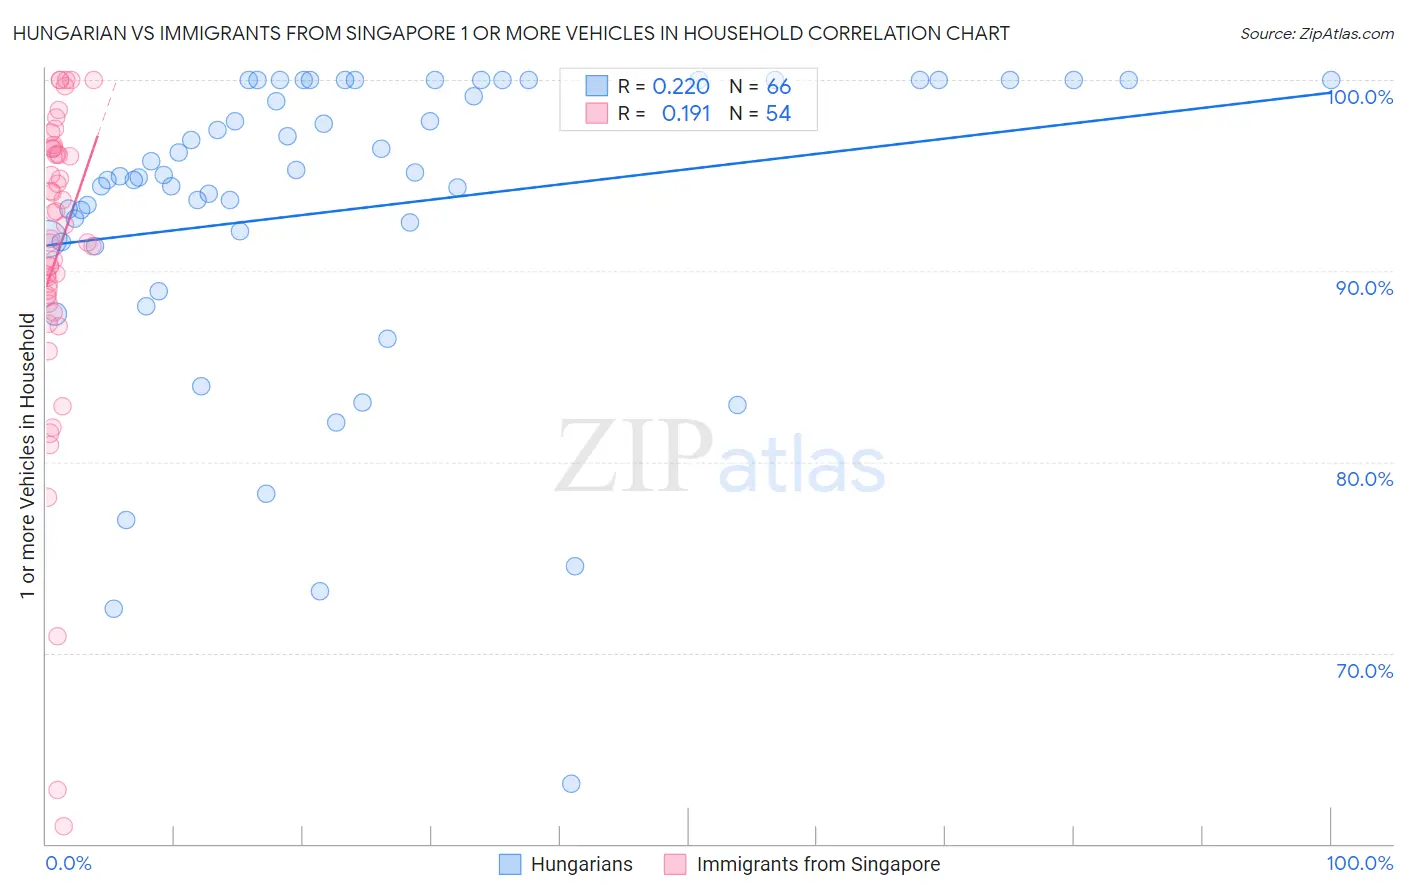
Hungarian vs Immigrants from Singapore 1 or more Vehicles in Household Correlation Chart
The statistical analysis conducted on geographies consisting of 485,902,681 people shows a weak positive correlation between the proportion of Hungarians and percentage of households with 1 or more vehicles available in the United States with a correlation coefficient (R) of 0.220 and weighted average of 90.3%. Similarly, the statistical analysis conducted on geographies consisting of 137,467,600 people shows a poor positive correlation between the proportion of Immigrants from Singapore and percentage of households with 1 or more vehicles available in the United States with a correlation coefficient (R) of 0.191 and weighted average of 87.2%, a difference of 3.6%.
1 or more Vehicles in Household Correlation Summary
| Measurement | Hungarian | Immigrants from Singapore |
| Minimum | 63.1% | 60.9% |
| Maximum | 100.0% | 100.0% |
| Range | 36.9% | 39.1% |
| Mean | 93.2% | 90.8% |
| Median | 95.0% | 92.0% |
| Interquartile 25% (IQ1) | 91.7% | 88.6% |
| Interquartile 75% (IQ3) | 100.0% | 96.4% |
| Interquartile Range (IQR) | 8.3% | 7.8% |
| Standard Deviation (Sample) | 8.1% | 8.3% |
| Standard Deviation (Population) | 8.0% | 8.3% |
Similar Demographics by 1 or more Vehicles in Household
Demographics Similar to Hungarians by 1 or more Vehicles in Household
In terms of 1 or more vehicles in household, the demographic groups most similar to Hungarians are Latvian (90.3%, a difference of 0.010%), Syrian (90.3%, a difference of 0.010%), Kenyan (90.4%, a difference of 0.020%), Immigrants from Oceania (90.4%, a difference of 0.020%), and Estonian (90.3%, a difference of 0.030%).
| Demographics | Rating | Rank | 1 or more Vehicles in Household |
| Marshallese | 88.9 /100 | #129 | Excellent 90.4% |
| Nicaraguans | 88.8 /100 | #130 | Excellent 90.4% |
| Immigrants | Kenya | 88.5 /100 | #131 | Excellent 90.4% |
| Immigrants | South Africa | 88.1 /100 | #132 | Excellent 90.4% |
| Immigrants | Syria | 87.5 /100 | #133 | Excellent 90.4% |
| Kenyans | 87.0 /100 | #134 | Excellent 90.4% |
| Immigrants | Oceania | 86.9 /100 | #135 | Excellent 90.4% |
| Hungarians | 86.5 /100 | #136 | Excellent 90.3% |
| Latvians | 86.3 /100 | #137 | Excellent 90.3% |
| Syrians | 86.3 /100 | #138 | Excellent 90.3% |
| Estonians | 85.6 /100 | #139 | Excellent 90.3% |
| Sudanese | 85.2 /100 | #140 | Excellent 90.3% |
| Immigrants | Moldova | 83.1 /100 | #141 | Excellent 90.2% |
| Immigrants | Lithuania | 83.0 /100 | #142 | Excellent 90.2% |
| Immigrants | Bahamas | 81.5 /100 | #143 | Excellent 90.2% |
Demographics Similar to Immigrants from Singapore by 1 or more Vehicles in Household
In terms of 1 or more vehicles in household, the demographic groups most similar to Immigrants from Singapore are Immigrants from France (87.1%, a difference of 0.070%), Alsatian (87.1%, a difference of 0.13%), Immigrants from Southern Europe (87.1%, a difference of 0.17%), Immigrants from Albania (87.1%, a difference of 0.17%), and Immigrants from Croatia (87.0%, a difference of 0.20%).
| Demographics | Rating | Rank | 1 or more Vehicles in Household |
| Immigrants | Europe | 0.2 /100 | #268 | Tragic 87.6% |
| Immigrants | Africa | 0.2 /100 | #269 | Tragic 87.6% |
| Panamanians | 0.2 /100 | #270 | Tragic 87.5% |
| Bermudans | 0.2 /100 | #271 | Tragic 87.5% |
| Aleuts | 0.2 /100 | #272 | Tragic 87.5% |
| Immigrants | Northern Africa | 0.2 /100 | #273 | Tragic 87.4% |
| Immigrants | Morocco | 0.1 /100 | #274 | Tragic 87.4% |
| Immigrants | Singapore | 0.1 /100 | #275 | Tragic 87.2% |
| Immigrants | France | 0.1 /100 | #276 | Tragic 87.1% |
| Alsatians | 0.1 /100 | #277 | Tragic 87.1% |
| Immigrants | Southern Europe | 0.1 /100 | #278 | Tragic 87.1% |
| Immigrants | Albania | 0.1 /100 | #279 | Tragic 87.1% |
| Immigrants | Croatia | 0.0 /100 | #280 | Tragic 87.0% |
| Mongolians | 0.0 /100 | #281 | Tragic 87.0% |
| Colville | 0.0 /100 | #282 | Tragic 86.8% |