Immigrants from Asia vs Inupiat 2 or more Vehicles in Household
COMPARE
Immigrants from Asia
Inupiat
2 or more Vehicles in Household
2 or more Vehicles in Household Comparison
Immigrants from Asia
Inupiat
56.3%
2 OR MORE VEHICLES IN HOUSEHOLD
86.0/ 100
METRIC RATING
136th/ 347
METRIC RANK
42.6%
2 OR MORE VEHICLES IN HOUSEHOLD
0.0/ 100
METRIC RATING
328th/ 347
METRIC RANK
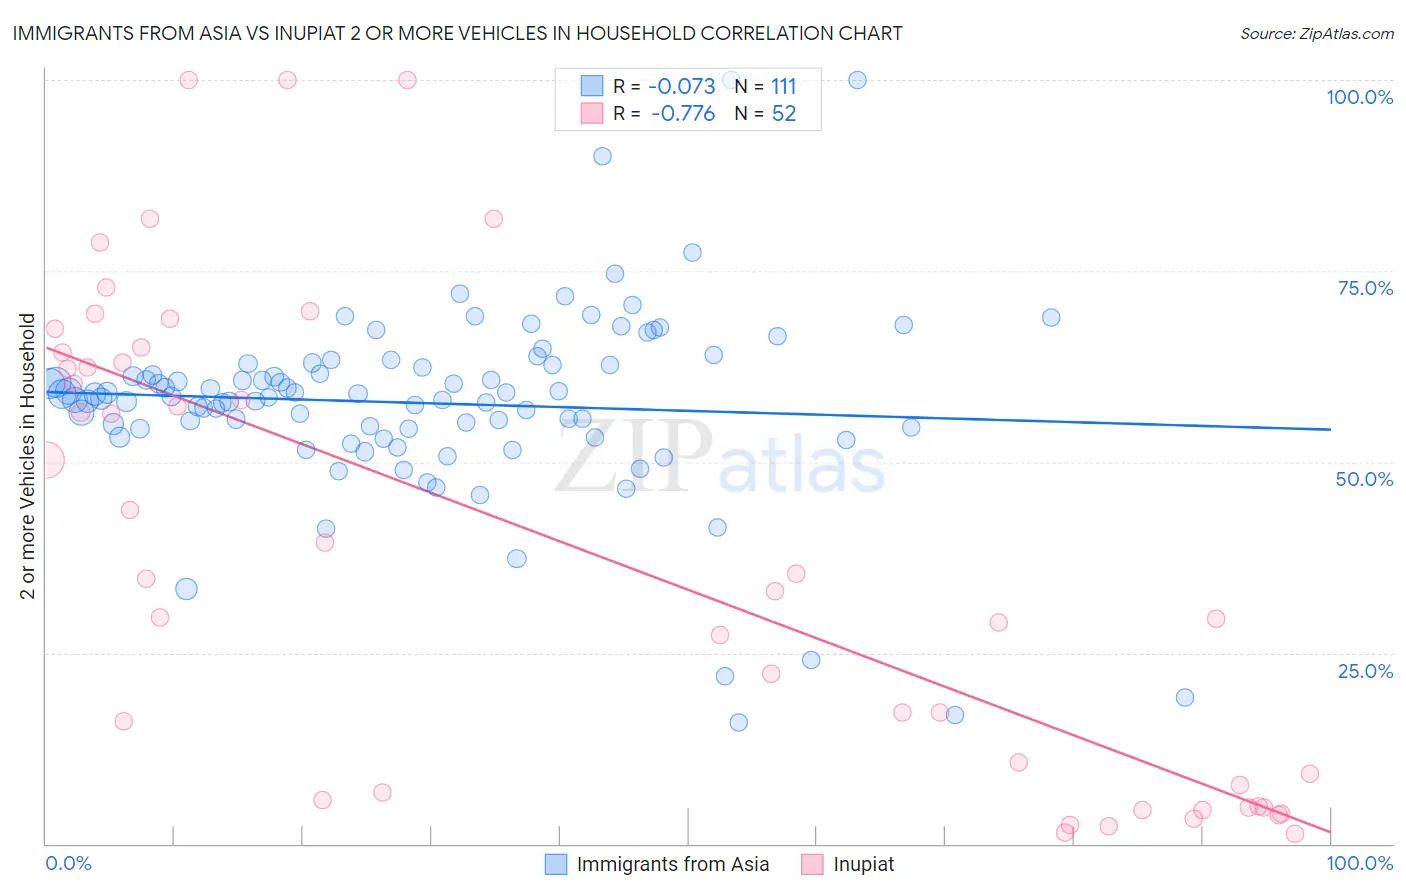
Immigrants from Asia vs Inupiat 2 or more Vehicles in Household Correlation Chart
The statistical analysis conducted on geographies consisting of 548,501,460 people shows a slight negative correlation between the proportion of Immigrants from Asia and percentage of households with 2 or more vehicles available in the United States with a correlation coefficient (R) of -0.073 and weighted average of 56.3%. Similarly, the statistical analysis conducted on geographies consisting of 96,302,889 people shows a strong negative correlation between the proportion of Inupiat and percentage of households with 2 or more vehicles available in the United States with a correlation coefficient (R) of -0.776 and weighted average of 42.6%, a difference of 32.2%.
2 or more Vehicles in Household Correlation Summary
| Measurement | Immigrants from Asia | Inupiat |
| Minimum | 15.8% | 1.4% |
| Maximum | 100.0% | 100.0% |
| Range | 84.2% | 98.6% |
| Mean | 57.7% | 38.5% |
| Median | 58.5% | 33.9% |
| Interquartile 25% (IQ1) | 54.4% | 6.2% |
| Interquartile 75% (IQ3) | 62.7% | 63.7% |
| Interquartile Range (IQR) | 8.2% | 57.5% |
| Standard Deviation (Sample) | 12.7% | 30.7% |
| Standard Deviation (Population) | 12.6% | 30.4% |
Similar Demographics by 2 or more Vehicles in Household
Demographics Similar to Immigrants from Asia by 2 or more Vehicles in Household
In terms of 2 or more vehicles in household, the demographic groups most similar to Immigrants from Asia are Blackfeet (56.4%, a difference of 0.040%), Immigrants from the Azores (56.4%, a difference of 0.050%), Cuban (56.3%, a difference of 0.090%), Salvadoran (56.3%, a difference of 0.10%), and Armenian (56.3%, a difference of 0.13%).
| Demographics | Rating | Rank | 2 or more Vehicles in Household |
| Ute | 90.4 /100 | #129 | Exceptional 56.6% |
| Yugoslavians | 90.0 /100 | #130 | Exceptional 56.6% |
| Bulgarians | 89.7 /100 | #131 | Excellent 56.5% |
| Hungarians | 89.1 /100 | #132 | Excellent 56.5% |
| Comanche | 88.4 /100 | #133 | Excellent 56.5% |
| Immigrants | Azores | 86.6 /100 | #134 | Excellent 56.4% |
| Blackfeet | 86.5 /100 | #135 | Excellent 56.4% |
| Immigrants | Asia | 86.0 /100 | #136 | Excellent 56.3% |
| Cubans | 84.8 /100 | #137 | Excellent 56.3% |
| Salvadorans | 84.7 /100 | #138 | Excellent 56.3% |
| Armenians | 84.3 /100 | #139 | Excellent 56.3% |
| Latvians | 83.6 /100 | #140 | Excellent 56.2% |
| Immigrants | Cambodia | 83.6 /100 | #141 | Excellent 56.2% |
| South Africans | 83.1 /100 | #142 | Excellent 56.2% |
| Seminole | 81.7 /100 | #143 | Excellent 56.2% |
Demographics Similar to Inupiat by 2 or more Vehicles in Household
In terms of 2 or more vehicles in household, the demographic groups most similar to Inupiat are Immigrants from Yemen (42.8%, a difference of 0.50%), Immigrants from Senegal (43.0%, a difference of 0.91%), Immigrants from West Indies (43.1%, a difference of 1.1%), Ecuadorian (42.0%, a difference of 1.6%), and Immigrants from Cabo Verde (43.3%, a difference of 1.6%).
| Demographics | Rating | Rank | 2 or more Vehicles in Household |
| Immigrants | Jamaica | 0.0 /100 | #321 | Tragic 44.5% |
| Senegalese | 0.0 /100 | #322 | Tragic 44.2% |
| Immigrants | Caribbean | 0.0 /100 | #323 | Tragic 44.2% |
| Immigrants | Cabo Verde | 0.0 /100 | #324 | Tragic 43.3% |
| Immigrants | West Indies | 0.0 /100 | #325 | Tragic 43.1% |
| Immigrants | Senegal | 0.0 /100 | #326 | Tragic 43.0% |
| Immigrants | Yemen | 0.0 /100 | #327 | Tragic 42.8% |
| Inupiat | 0.0 /100 | #328 | Tragic 42.6% |
| Ecuadorians | 0.0 /100 | #329 | Tragic 42.0% |
| Immigrants | Dominica | 0.0 /100 | #330 | Tragic 41.6% |
| West Indians | 0.0 /100 | #331 | Tragic 41.3% |
| Trinidadians and Tobagonians | 0.0 /100 | #332 | Tragic 40.9% |
| Immigrants | Ecuador | 0.0 /100 | #333 | Tragic 40.5% |
| Immigrants | Trinidad and Tobago | 0.0 /100 | #334 | Tragic 40.3% |
| Immigrants | Bangladesh | 0.0 /100 | #335 | Tragic 38.8% |