Syrian vs Spanish 2 or more Vehicles in Household
COMPARE
Syrian
Spanish
2 or more Vehicles in Household
2 or more Vehicles in Household Comparison
Syrians
Spanish
56.2%
2 OR MORE VEHICLES IN HOUSEHOLD
81.2/ 100
METRIC RATING
145th/ 347
METRIC RANK
60.2%
2 OR MORE VEHICLES IN HOUSEHOLD
100.0/ 100
METRIC RATING
34th/ 347
METRIC RANK
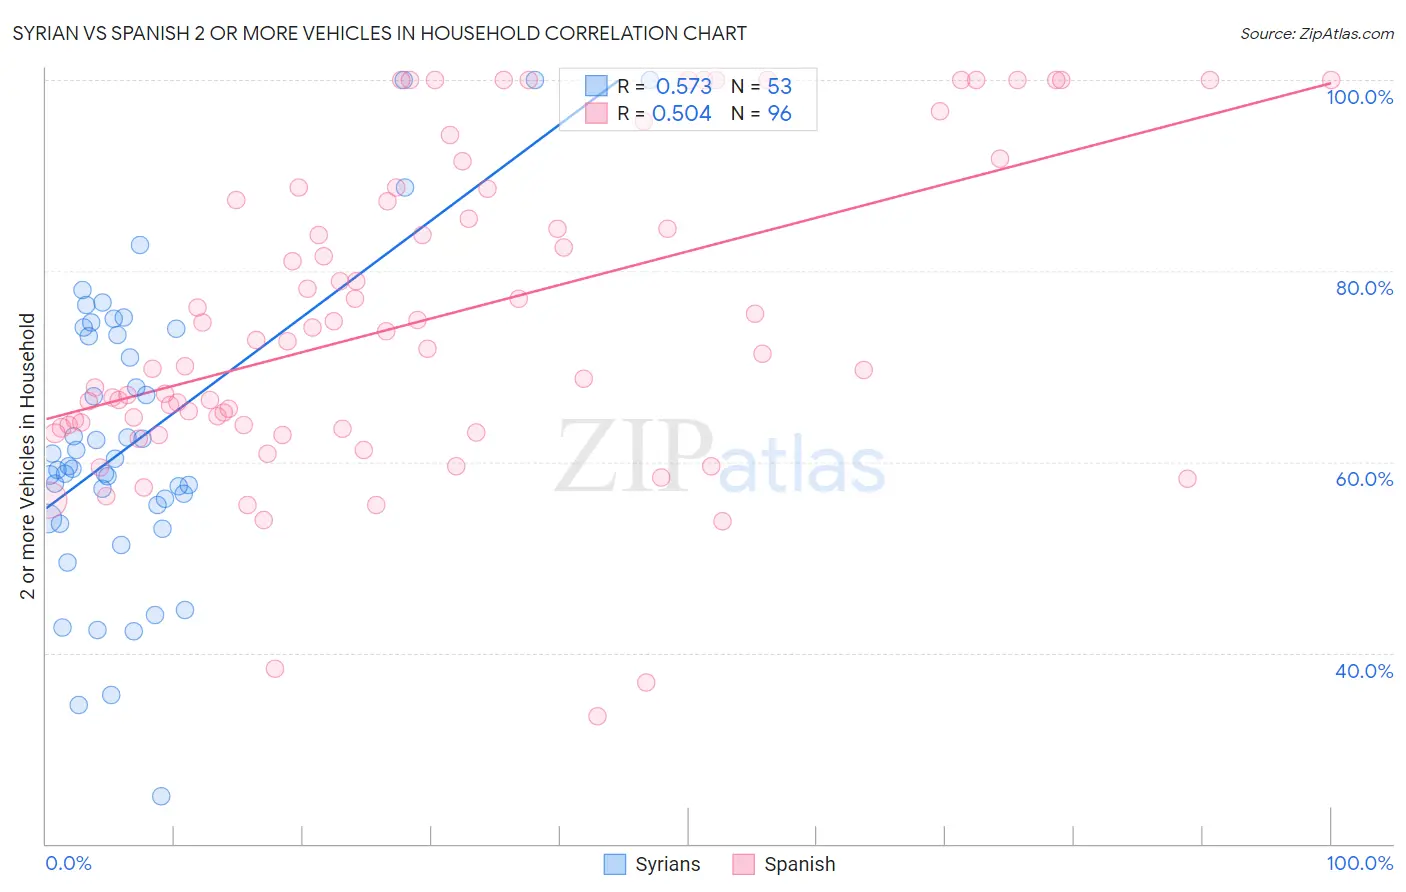
Syrian vs Spanish 2 or more Vehicles in Household Correlation Chart
The statistical analysis conducted on geographies consisting of 266,212,507 people shows a substantial positive correlation between the proportion of Syrians and percentage of households with 2 or more vehicles available in the United States with a correlation coefficient (R) of 0.573 and weighted average of 56.2%. Similarly, the statistical analysis conducted on geographies consisting of 421,956,041 people shows a substantial positive correlation between the proportion of Spanish and percentage of households with 2 or more vehicles available in the United States with a correlation coefficient (R) of 0.504 and weighted average of 60.2%, a difference of 7.2%.
2 or more Vehicles in Household Correlation Summary
| Measurement | Syrian | Spanish |
| Minimum | 25.0% | 33.3% |
| Maximum | 100.0% | 100.0% |
| Range | 75.0% | 66.7% |
| Mean | 62.4% | 74.9% |
| Median | 59.5% | 72.2% |
| Interquartile 25% (IQ1) | 54.8% | 63.7% |
| Interquartile 75% (IQ3) | 73.6% | 88.0% |
| Interquartile Range (IQR) | 18.8% | 24.3% |
| Standard Deviation (Sample) | 15.6% | 16.2% |
| Standard Deviation (Population) | 15.5% | 16.1% |
Similar Demographics by 2 or more Vehicles in Household
Demographics Similar to Syrians by 2 or more Vehicles in Household
In terms of 2 or more vehicles in household, the demographic groups most similar to Syrians are Immigrants from Syria (56.2%, a difference of 0.010%), Seminole (56.2%, a difference of 0.030%), Venezuelan (56.1%, a difference of 0.030%), Serbian (56.1%, a difference of 0.060%), and Immigrants from Moldova (56.1%, a difference of 0.060%).
| Demographics | Rating | Rank | 2 or more Vehicles in Household |
| Salvadorans | 84.7 /100 | #138 | Excellent 56.3% |
| Armenians | 84.3 /100 | #139 | Excellent 56.3% |
| Latvians | 83.6 /100 | #140 | Excellent 56.2% |
| Immigrants | Cambodia | 83.6 /100 | #141 | Excellent 56.2% |
| South Africans | 83.1 /100 | #142 | Excellent 56.2% |
| Seminole | 81.7 /100 | #143 | Excellent 56.2% |
| Immigrants | Syria | 81.4 /100 | #144 | Excellent 56.2% |
| Syrians | 81.2 /100 | #145 | Excellent 56.2% |
| Venezuelans | 80.7 /100 | #146 | Excellent 56.1% |
| Serbians | 80.3 /100 | #147 | Excellent 56.1% |
| Immigrants | Moldova | 80.2 /100 | #148 | Excellent 56.1% |
| Chileans | 80.2 /100 | #149 | Excellent 56.1% |
| Nicaraguans | 79.9 /100 | #150 | Good 56.1% |
| Immigrants | Northern Europe | 78.7 /100 | #151 | Good 56.1% |
| Immigrants | Pakistan | 78.1 /100 | #152 | Good 56.1% |
Demographics Similar to Spanish by 2 or more Vehicles in Household
In terms of 2 or more vehicles in household, the demographic groups most similar to Spanish are Immigrants from Mexico (60.2%, a difference of 0.050%), Arapaho (60.2%, a difference of 0.11%), Immigrants from Philippines (60.1%, a difference of 0.12%), Chinese (60.1%, a difference of 0.14%), and Irish (60.1%, a difference of 0.18%).
| Demographics | Rating | Rank | 2 or more Vehicles in Household |
| Assyrians/Chaldeans/Syriacs | 100.0 /100 | #27 | Exceptional 60.5% |
| Guamanians/Chamorros | 100.0 /100 | #28 | Exceptional 60.5% |
| Hawaiians | 100.0 /100 | #29 | Exceptional 60.4% |
| Finns | 100.0 /100 | #30 | Exceptional 60.3% |
| Spanish American Indians | 100.0 /100 | #31 | Exceptional 60.3% |
| Arapaho | 100.0 /100 | #32 | Exceptional 60.2% |
| Immigrants | Mexico | 100.0 /100 | #33 | Exceptional 60.2% |
| Spanish | 100.0 /100 | #34 | Exceptional 60.2% |
| Immigrants | Philippines | 100.0 /100 | #35 | Exceptional 60.1% |
| Chinese | 100.0 /100 | #36 | Exceptional 60.1% |
| Irish | 100.0 /100 | #37 | Exceptional 60.1% |
| Americans | 100.0 /100 | #38 | Exceptional 60.0% |
| British | 100.0 /100 | #39 | Exceptional 60.0% |
| Cherokee | 100.0 /100 | #40 | Exceptional 59.9% |
| Northern Europeans | 100.0 /100 | #41 | Exceptional 59.9% |