Hungarian vs Greek 1 or more Vehicles in Household
COMPARE
Hungarian
Greek
1 or more Vehicles in Household
1 or more Vehicles in Household Comparison
Hungarians
Greeks
90.3%
1 OR MORE VEHICLES IN HOUSEHOLD
86.5/ 100
METRIC RATING
136th/ 347
METRIC RANK
90.6%
1 OR MORE VEHICLES IN HOUSEHOLD
93.5/ 100
METRIC RATING
117th/ 347
METRIC RANK
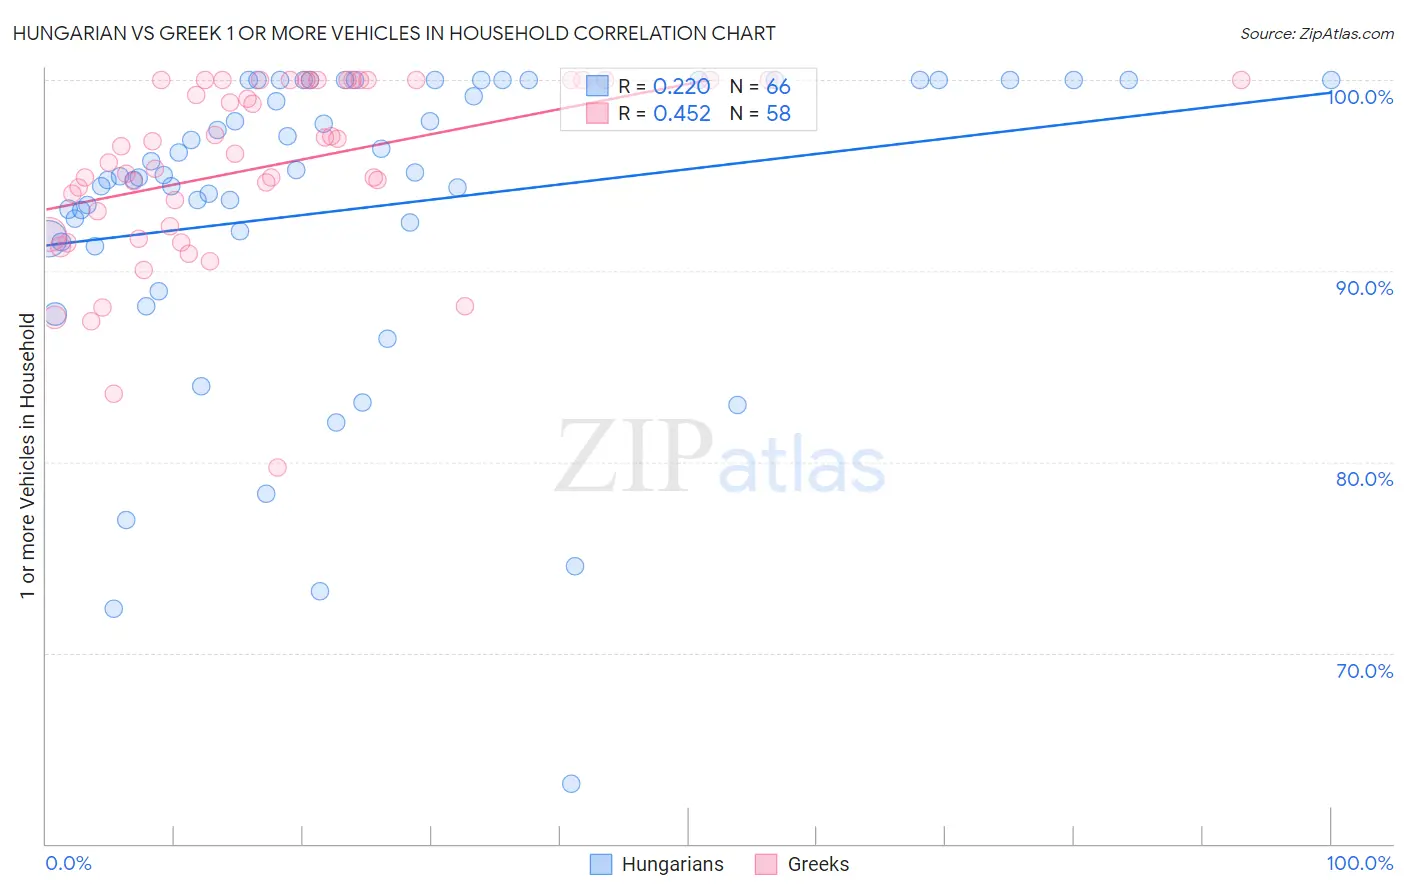
Hungarian vs Greek 1 or more Vehicles in Household Correlation Chart
The statistical analysis conducted on geographies consisting of 485,902,681 people shows a weak positive correlation between the proportion of Hungarians and percentage of households with 1 or more vehicles available in the United States with a correlation coefficient (R) of 0.220 and weighted average of 90.3%. Similarly, the statistical analysis conducted on geographies consisting of 482,364,894 people shows a moderate positive correlation between the proportion of Greeks and percentage of households with 1 or more vehicles available in the United States with a correlation coefficient (R) of 0.452 and weighted average of 90.6%, a difference of 0.31%.
1 or more Vehicles in Household Correlation Summary
| Measurement | Hungarian | Greek |
| Minimum | 63.1% | 79.7% |
| Maximum | 100.0% | 100.0% |
| Range | 36.9% | 20.3% |
| Mean | 93.2% | 95.5% |
| Median | 95.0% | 96.3% |
| Interquartile 25% (IQ1) | 91.7% | 92.4% |
| Interquartile 75% (IQ3) | 100.0% | 100.0% |
| Interquartile Range (IQR) | 8.3% | 7.6% |
| Standard Deviation (Sample) | 8.1% | 4.7% |
| Standard Deviation (Population) | 8.0% | 4.7% |
Demographics Similar to Hungarians and Greeks by 1 or more Vehicles in Household
In terms of 1 or more vehicles in household, the demographic groups most similar to Hungarians are Kenyan (90.4%, a difference of 0.020%), Immigrants from Oceania (90.4%, a difference of 0.020%), Immigrants from Syria (90.4%, a difference of 0.040%), Immigrants from South Africa (90.4%, a difference of 0.060%), and Immigrants from Kenya (90.4%, a difference of 0.070%). Similarly, the demographic groups most similar to Greeks are Japanese (90.6%, a difference of 0.010%), Chippewa (90.7%, a difference of 0.050%), Blackfeet (90.6%, a difference of 0.050%), Immigrants from Thailand (90.6%, a difference of 0.070%), and Icelander (90.5%, a difference of 0.080%).
| Demographics | Rating | Rank | 1 or more Vehicles in Household |
| Chippewa | 94.3 /100 | #116 | Exceptional 90.7% |
| Greeks | 93.5 /100 | #117 | Exceptional 90.6% |
| Japanese | 93.4 /100 | #118 | Exceptional 90.6% |
| Blackfeet | 92.6 /100 | #119 | Exceptional 90.6% |
| Immigrants | Thailand | 92.3 /100 | #120 | Exceptional 90.6% |
| Icelanders | 92.1 /100 | #121 | Exceptional 90.5% |
| Costa Ricans | 92.0 /100 | #122 | Exceptional 90.5% |
| Fijians | 91.8 /100 | #123 | Exceptional 90.5% |
| Puget Sound Salish | 91.5 /100 | #124 | Exceptional 90.5% |
| Immigrants | Korea | 90.5 /100 | #125 | Exceptional 90.5% |
| Immigrants | Cameroon | 89.4 /100 | #126 | Excellent 90.4% |
| Immigrants | Azores | 89.1 /100 | #127 | Excellent 90.4% |
| Burmese | 89.0 /100 | #128 | Excellent 90.4% |
| Marshallese | 88.9 /100 | #129 | Excellent 90.4% |
| Nicaraguans | 88.8 /100 | #130 | Excellent 90.4% |
| Immigrants | Kenya | 88.5 /100 | #131 | Excellent 90.4% |
| Immigrants | South Africa | 88.1 /100 | #132 | Excellent 90.4% |
| Immigrants | Syria | 87.5 /100 | #133 | Excellent 90.4% |
| Kenyans | 87.0 /100 | #134 | Excellent 90.4% |
| Immigrants | Oceania | 86.9 /100 | #135 | Excellent 90.4% |
| Hungarians | 86.5 /100 | #136 | Excellent 90.3% |