Hungarian vs Immigrants from Switzerland 1 or more Vehicles in Household
COMPARE
Hungarian
Immigrants from Switzerland
1 or more Vehicles in Household
1 or more Vehicles in Household Comparison
Hungarians
Immigrants from Switzerland
90.3%
1 OR MORE VEHICLES IN HOUSEHOLD
86.5/ 100
METRIC RATING
136th/ 347
METRIC RANK
87.9%
1 OR MORE VEHICLES IN HOUSEHOLD
0.6/ 100
METRIC RATING
261st/ 347
METRIC RANK
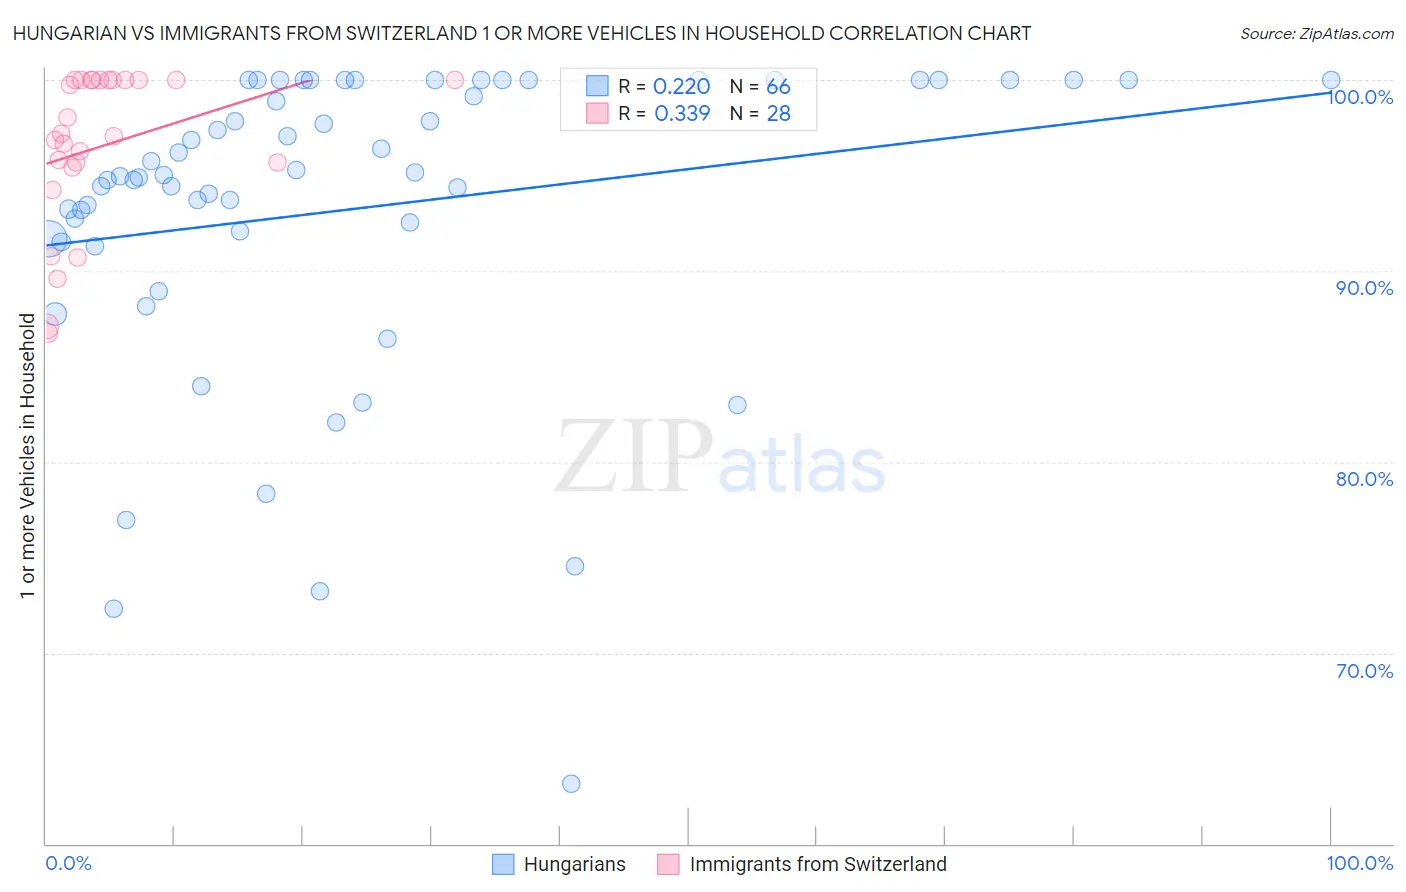
Hungarian vs Immigrants from Switzerland 1 or more Vehicles in Household Correlation Chart
The statistical analysis conducted on geographies consisting of 485,902,681 people shows a weak positive correlation between the proportion of Hungarians and percentage of households with 1 or more vehicles available in the United States with a correlation coefficient (R) of 0.220 and weighted average of 90.3%. Similarly, the statistical analysis conducted on geographies consisting of 148,062,168 people shows a mild positive correlation between the proportion of Immigrants from Switzerland and percentage of households with 1 or more vehicles available in the United States with a correlation coefficient (R) of 0.339 and weighted average of 87.9%, a difference of 2.8%.
1 or more Vehicles in Household Correlation Summary
| Measurement | Hungarian | Immigrants from Switzerland |
| Minimum | 63.1% | 86.7% |
| Maximum | 100.0% | 100.0% |
| Range | 36.9% | 13.3% |
| Mean | 93.2% | 96.6% |
| Median | 95.0% | 97.1% |
| Interquartile 25% (IQ1) | 91.7% | 95.5% |
| Interquartile 75% (IQ3) | 100.0% | 100.0% |
| Interquartile Range (IQR) | 8.3% | 4.5% |
| Standard Deviation (Sample) | 8.1% | 4.1% |
| Standard Deviation (Population) | 8.0% | 4.0% |
Similar Demographics by 1 or more Vehicles in Household
Demographics Similar to Hungarians by 1 or more Vehicles in Household
In terms of 1 or more vehicles in household, the demographic groups most similar to Hungarians are Latvian (90.3%, a difference of 0.010%), Syrian (90.3%, a difference of 0.010%), Kenyan (90.4%, a difference of 0.020%), Immigrants from Oceania (90.4%, a difference of 0.020%), and Estonian (90.3%, a difference of 0.030%).
| Demographics | Rating | Rank | 1 or more Vehicles in Household |
| Marshallese | 88.9 /100 | #129 | Excellent 90.4% |
| Nicaraguans | 88.8 /100 | #130 | Excellent 90.4% |
| Immigrants | Kenya | 88.5 /100 | #131 | Excellent 90.4% |
| Immigrants | South Africa | 88.1 /100 | #132 | Excellent 90.4% |
| Immigrants | Syria | 87.5 /100 | #133 | Excellent 90.4% |
| Kenyans | 87.0 /100 | #134 | Excellent 90.4% |
| Immigrants | Oceania | 86.9 /100 | #135 | Excellent 90.4% |
| Hungarians | 86.5 /100 | #136 | Excellent 90.3% |
| Latvians | 86.3 /100 | #137 | Excellent 90.3% |
| Syrians | 86.3 /100 | #138 | Excellent 90.3% |
| Estonians | 85.6 /100 | #139 | Excellent 90.3% |
| Sudanese | 85.2 /100 | #140 | Excellent 90.3% |
| Immigrants | Moldova | 83.1 /100 | #141 | Excellent 90.2% |
| Immigrants | Lithuania | 83.0 /100 | #142 | Excellent 90.2% |
| Immigrants | Bahamas | 81.5 /100 | #143 | Excellent 90.2% |
Demographics Similar to Immigrants from Switzerland by 1 or more Vehicles in Household
In terms of 1 or more vehicles in household, the demographic groups most similar to Immigrants from Switzerland are Subsaharan African (87.9%, a difference of 0.030%), Macedonian (87.9%, a difference of 0.040%), Immigrants from Egypt (87.8%, a difference of 0.10%), Immigrants from Liberia (87.8%, a difference of 0.11%), and Nigerian (88.0%, a difference of 0.13%).
| Demographics | Rating | Rank | 1 or more Vehicles in Household |
| Haitians | 0.9 /100 | #254 | Tragic 88.1% |
| Immigrants | Latvia | 0.9 /100 | #255 | Tragic 88.1% |
| Colombians | 0.9 /100 | #256 | Tragic 88.0% |
| Liberians | 0.9 /100 | #257 | Tragic 88.0% |
| South American Indians | 0.9 /100 | #258 | Tragic 88.0% |
| Nigerians | 0.8 /100 | #259 | Tragic 88.0% |
| Macedonians | 0.6 /100 | #260 | Tragic 87.9% |
| Immigrants | Switzerland | 0.6 /100 | #261 | Tragic 87.9% |
| Sub-Saharan Africans | 0.5 /100 | #262 | Tragic 87.9% |
| Immigrants | Egypt | 0.5 /100 | #263 | Tragic 87.8% |
| Immigrants | Liberia | 0.4 /100 | #264 | Tragic 87.8% |
| Africans | 0.4 /100 | #265 | Tragic 87.8% |
| Israelis | 0.3 /100 | #266 | Tragic 87.7% |
| Immigrants | Colombia | 0.3 /100 | #267 | Tragic 87.6% |
| Immigrants | Europe | 0.2 /100 | #268 | Tragic 87.6% |