Honduran vs Immigrants from Grenada Male Unemployment
COMPARE
Honduran
Immigrants from Grenada
Male Unemployment
Male Unemployment Comparison
Hondurans
Immigrants from Grenada
5.6%
MALE UNEMPLOYMENT
1.1/ 100
METRIC RATING
237th/ 347
METRIC RANK
7.6%
MALE UNEMPLOYMENT
0.0/ 100
METRIC RATING
323rd/ 347
METRIC RANK
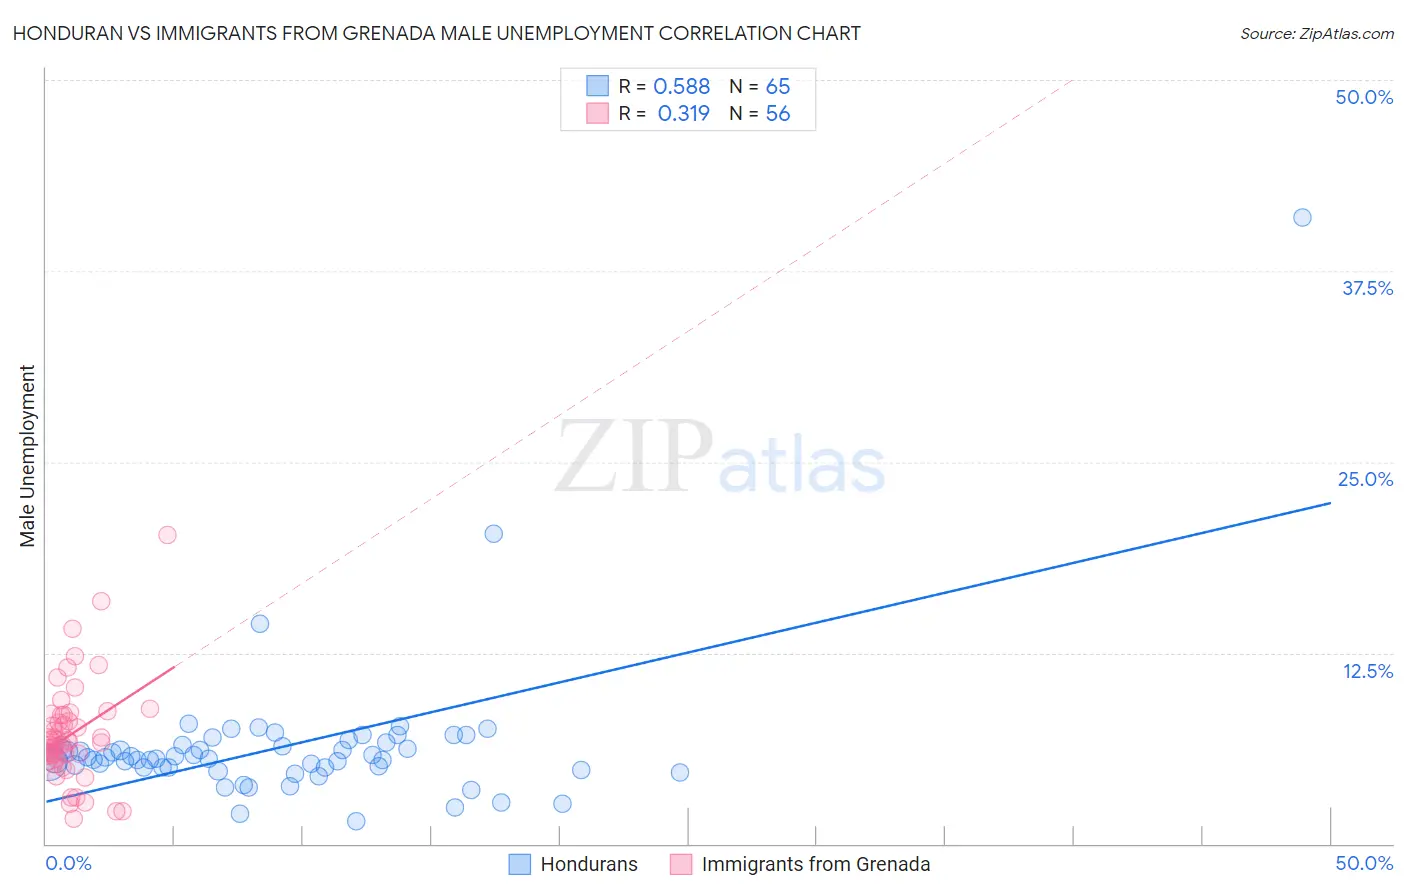
Honduran vs Immigrants from Grenada Male Unemployment Correlation Chart
The statistical analysis conducted on geographies consisting of 356,702,099 people shows a substantial positive correlation between the proportion of Hondurans and unemployment rate among males in the United States with a correlation coefficient (R) of 0.588 and weighted average of 5.6%. Similarly, the statistical analysis conducted on geographies consisting of 67,158,645 people shows a mild positive correlation between the proportion of Immigrants from Grenada and unemployment rate among males in the United States with a correlation coefficient (R) of 0.319 and weighted average of 7.6%, a difference of 33.9%.
Male Unemployment Correlation Summary
| Measurement | Honduran | Immigrants from Grenada |
| Minimum | 1.5% | 1.6% |
| Maximum | 41.0% | 20.2% |
| Range | 39.5% | 18.6% |
| Mean | 6.4% | 7.2% |
| Median | 5.5% | 6.7% |
| Interquartile 25% (IQ1) | 5.0% | 5.7% |
| Interquartile 75% (IQ3) | 6.6% | 8.4% |
| Interquartile Range (IQR) | 1.6% | 2.7% |
| Standard Deviation (Sample) | 5.0% | 3.3% |
| Standard Deviation (Population) | 5.0% | 3.3% |
Similar Demographics by Male Unemployment
Demographics Similar to Hondurans by Male Unemployment
In terms of male unemployment, the demographic groups most similar to Hondurans are Native Hawaiian (5.6%, a difference of 0.050%), Immigrants from Guatemala (5.6%, a difference of 0.050%), Guatemalan (5.6%, a difference of 0.090%), Immigrants from Cameroon (5.6%, a difference of 0.12%), and Salvadoran (5.7%, a difference of 0.16%).
| Demographics | Rating | Rank | Male Unemployment |
| Immigrants | Africa | 1.7 /100 | #230 | Tragic 5.6% |
| Choctaw | 1.6 /100 | #231 | Tragic 5.6% |
| Moroccans | 1.6 /100 | #232 | Tragic 5.6% |
| Somalis | 1.5 /100 | #233 | Tragic 5.6% |
| Immigrants | Somalia | 1.5 /100 | #234 | Tragic 5.6% |
| Immigrants | Honduras | 1.5 /100 | #235 | Tragic 5.6% |
| Guatemalans | 1.2 /100 | #236 | Tragic 5.6% |
| Hondurans | 1.1 /100 | #237 | Tragic 5.6% |
| Native Hawaiians | 1.1 /100 | #238 | Tragic 5.6% |
| Immigrants | Guatemala | 1.1 /100 | #239 | Tragic 5.6% |
| Immigrants | Cameroon | 1.0 /100 | #240 | Tragic 5.6% |
| Salvadorans | 1.0 /100 | #241 | Tragic 5.7% |
| Ottawa | 0.9 /100 | #242 | Tragic 5.7% |
| Bangladeshis | 0.8 /100 | #243 | Tragic 5.7% |
| Immigrants | El Salvador | 0.7 /100 | #244 | Tragic 5.7% |
Demographics Similar to Immigrants from Grenada by Male Unemployment
In terms of male unemployment, the demographic groups most similar to Immigrants from Grenada are Dominican (7.6%, a difference of 0.27%), Shoshone (7.6%, a difference of 0.65%), Immigrants from Dominican Republic (7.6%, a difference of 0.75%), Immigrants from Cabo Verde (7.5%, a difference of 0.79%), and Immigrants from St. Vincent and the Grenadines (7.5%, a difference of 1.1%).
| Demographics | Rating | Rank | Male Unemployment |
| Immigrants | Guyana | 0.0 /100 | #316 | Tragic 7.1% |
| Guyanese | 0.0 /100 | #317 | Tragic 7.1% |
| Cape Verdeans | 0.0 /100 | #318 | Tragic 7.1% |
| British West Indians | 0.0 /100 | #319 | Tragic 7.3% |
| Colville | 0.0 /100 | #320 | Tragic 7.4% |
| Immigrants | St. Vincent and the Grenadines | 0.0 /100 | #321 | Tragic 7.5% |
| Immigrants | Cabo Verde | 0.0 /100 | #322 | Tragic 7.5% |
| Immigrants | Grenada | 0.0 /100 | #323 | Tragic 7.6% |
| Dominicans | 0.0 /100 | #324 | Tragic 7.6% |
| Shoshone | 0.0 /100 | #325 | Tragic 7.6% |
| Immigrants | Dominican Republic | 0.0 /100 | #326 | Tragic 7.6% |
| Paiute | 0.0 /100 | #327 | Tragic 7.7% |
| Natives/Alaskans | 0.0 /100 | #328 | Tragic 7.7% |
| Immigrants | Yemen | 0.0 /100 | #329 | Tragic 7.8% |
| Yakama | 0.0 /100 | #330 | Tragic 7.9% |