Creek vs Cypriot 4 or more Vehicles in Household
COMPARE
Creek
Cypriot
4 or more Vehicles in Household
4 or more Vehicles in Household Comparison
Creek
Cypriots
7.2%
4 OR MORE VEHICLES IN HOUSEHOLD
99.6/ 100
METRIC RATING
90th/ 347
METRIC RANK
5.0%
4 OR MORE VEHICLES IN HOUSEHOLD
0.0/ 100
METRIC RATING
304th/ 347
METRIC RANK
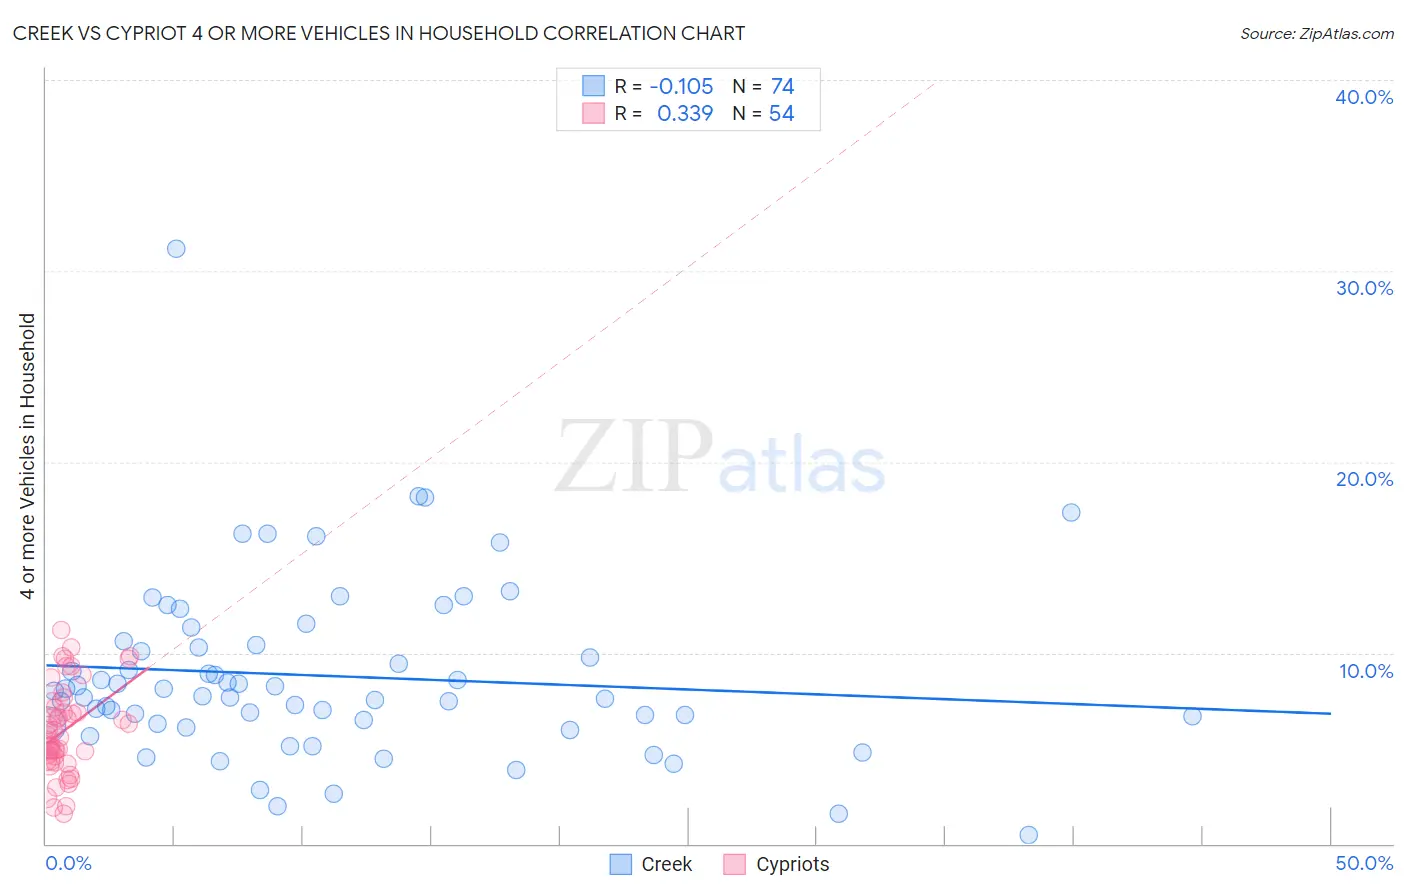
Creek vs Cypriot 4 or more Vehicles in Household Correlation Chart
The statistical analysis conducted on geographies consisting of 178,228,664 people shows a poor negative correlation between the proportion of Creek and percentage of households with 4 or more vehicles available in the United States with a correlation coefficient (R) of -0.105 and weighted average of 7.2%. Similarly, the statistical analysis conducted on geographies consisting of 61,625,264 people shows a mild positive correlation between the proportion of Cypriots and percentage of households with 4 or more vehicles available in the United States with a correlation coefficient (R) of 0.339 and weighted average of 5.0%, a difference of 43.1%.
4 or more Vehicles in Household Correlation Summary
| Measurement | Creek | Cypriot |
| Minimum | 0.43% | 1.6% |
| Maximum | 31.1% | 11.2% |
| Range | 30.7% | 9.6% |
| Mean | 8.8% | 5.9% |
| Median | 7.9% | 5.6% |
| Interquartile 25% (IQ1) | 6.3% | 4.4% |
| Interquartile 75% (IQ3) | 10.4% | 7.1% |
| Interquartile Range (IQR) | 4.2% | 2.7% |
| Standard Deviation (Sample) | 4.7% | 2.3% |
| Standard Deviation (Population) | 4.6% | 2.3% |
Similar Demographics by 4 or more Vehicles in Household
Demographics Similar to Creek by 4 or more Vehicles in Household
In terms of 4 or more vehicles in household, the demographic groups most similar to Creek are British (7.2%, a difference of 0.080%), Nonimmigrants (7.2%, a difference of 0.41%), Delaware (7.2%, a difference of 0.44%), Immigrants from Indonesia (7.2%, a difference of 0.50%), and Assyrian/Chaldean/Syriac (7.2%, a difference of 0.56%).
| Demographics | Rating | Rank | 4 or more Vehicles in Household |
| Potawatomi | 99.7 /100 | #83 | Exceptional 7.3% |
| Afghans | 99.7 /100 | #84 | Exceptional 7.3% |
| Cree | 99.7 /100 | #85 | Exceptional 7.2% |
| Immigrants | Indonesia | 99.6 /100 | #86 | Exceptional 7.2% |
| Delaware | 99.6 /100 | #87 | Exceptional 7.2% |
| Immigrants | Nonimmigrants | 99.6 /100 | #88 | Exceptional 7.2% |
| British | 99.6 /100 | #89 | Exceptional 7.2% |
| Creek | 99.6 /100 | #90 | Exceptional 7.2% |
| Assyrians/Chaldeans/Syriacs | 99.4 /100 | #91 | Exceptional 7.2% |
| Immigrants | Latin America | 99.4 /100 | #92 | Exceptional 7.1% |
| Immigrants | Afghanistan | 99.3 /100 | #93 | Exceptional 7.1% |
| Dutch West Indians | 99.3 /100 | #94 | Exceptional 7.1% |
| Czechoslovakians | 99.3 /100 | #95 | Exceptional 7.1% |
| Central Americans | 99.3 /100 | #96 | Exceptional 7.1% |
| Celtics | 99.1 /100 | #97 | Exceptional 7.1% |
Demographics Similar to Cypriots by 4 or more Vehicles in Household
In terms of 4 or more vehicles in household, the demographic groups most similar to Cypriots are Somali (5.0%, a difference of 0.0%), Immigrants from Serbia (5.0%, a difference of 0.090%), Immigrants from Greece (5.1%, a difference of 0.55%), Bahamian (5.1%, a difference of 1.0%), and Menominee (5.0%, a difference of 1.0%).
| Demographics | Rating | Rank | 4 or more Vehicles in Household |
| Immigrants | Venezuela | 0.1 /100 | #297 | Tragic 5.2% |
| Immigrants | South America | 0.1 /100 | #298 | Tragic 5.2% |
| Immigrants | Ghana | 0.1 /100 | #299 | Tragic 5.2% |
| Immigrants | Morocco | 0.0 /100 | #300 | Tragic 5.1% |
| Immigrants | Zaire | 0.0 /100 | #301 | Tragic 5.1% |
| Bahamians | 0.0 /100 | #302 | Tragic 5.1% |
| Immigrants | Greece | 0.0 /100 | #303 | Tragic 5.1% |
| Cypriots | 0.0 /100 | #304 | Tragic 5.0% |
| Somalis | 0.0 /100 | #305 | Tragic 5.0% |
| Immigrants | Serbia | 0.0 /100 | #306 | Tragic 5.0% |
| Menominee | 0.0 /100 | #307 | Tragic 5.0% |
| Paraguayans | 0.0 /100 | #308 | Tragic 4.9% |
| Immigrants | Somalia | 0.0 /100 | #309 | Tragic 4.9% |
| Moroccans | 0.0 /100 | #310 | Tragic 4.9% |
| Houma | 0.0 /100 | #311 | Tragic 4.9% |