German vs Creek In Labor Force | Age 20-64
COMPARE
German
Creek
In Labor Force | Age 20-64
In Labor Force | Age 20-64 Comparison
Germans
Creek
79.7%
IN LABOR FORCE | AGE 20-64
65.2/ 100
METRIC RATING
162nd/ 347
METRIC RANK
75.1%
IN LABOR FORCE | AGE 20-64
0.0/ 100
METRIC RATING
326th/ 347
METRIC RANK
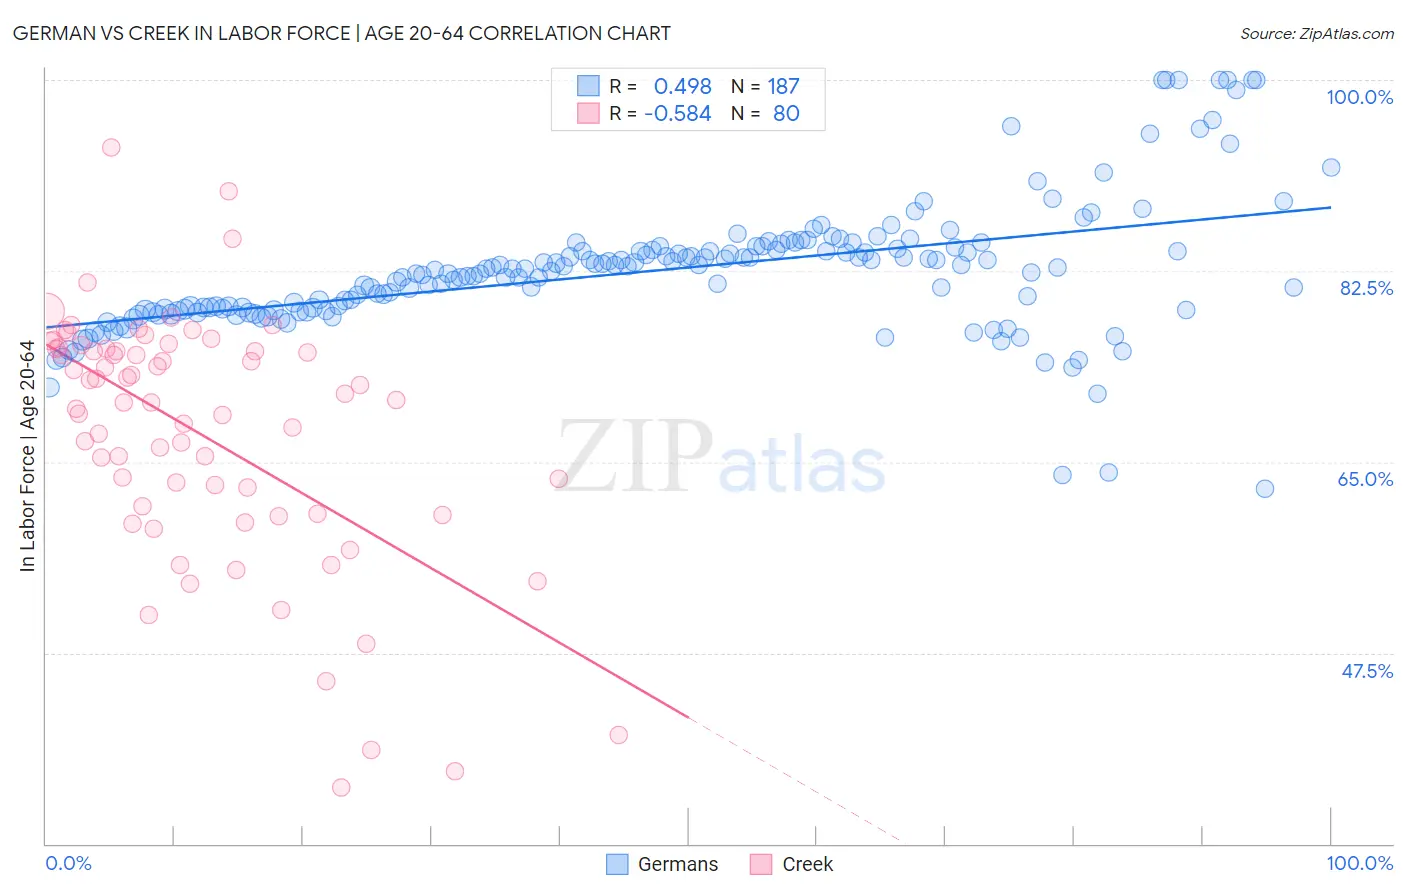
German vs Creek In Labor Force | Age 20-64 Correlation Chart
The statistical analysis conducted on geographies consisting of 581,278,345 people shows a moderate positive correlation between the proportion of Germans and labor force participation rate among population between the ages 20 and 64 in the United States with a correlation coefficient (R) of 0.498 and weighted average of 79.7%. Similarly, the statistical analysis conducted on geographies consisting of 178,467,518 people shows a substantial negative correlation between the proportion of Creek and labor force participation rate among population between the ages 20 and 64 in the United States with a correlation coefficient (R) of -0.584 and weighted average of 75.1%, a difference of 6.0%.
In Labor Force | Age 20-64 Correlation Summary
| Measurement | German | Creek |
| Minimum | 62.5% | 35.2% |
| Maximum | 100.0% | 93.8% |
| Range | 37.5% | 58.6% |
| Mean | 82.5% | 67.7% |
| Median | 82.6% | 70.6% |
| Interquartile 25% (IQ1) | 78.9% | 60.6% |
| Interquartile 75% (IQ3) | 84.4% | 75.4% |
| Interquartile Range (IQR) | 5.5% | 14.8% |
| Standard Deviation (Sample) | 6.1% | 11.5% |
| Standard Deviation (Population) | 6.1% | 11.4% |
Similar Demographics by In Labor Force | Age 20-64
Demographics Similar to Germans by In Labor Force | Age 20-64
In terms of in labor force | age 20-64, the demographic groups most similar to Germans are Immigrants from Cuba (79.7%, a difference of 0.010%), Moroccan (79.7%, a difference of 0.010%), South African (79.7%, a difference of 0.010%), Immigrants from Costa Rica (79.7%, a difference of 0.010%), and Immigrants from Burma/Myanmar (79.7%, a difference of 0.010%).
| Demographics | Rating | Rank | In Labor Force | Age 20-64 |
| Immigrants | South Africa | 69.2 /100 | #155 | Good 79.7% |
| Senegalese | 69.1 /100 | #156 | Good 79.7% |
| Immigrants | China | 69.1 /100 | #157 | Good 79.7% |
| Austrians | 67.6 /100 | #158 | Good 79.7% |
| Immigrants | Cuba | 66.7 /100 | #159 | Good 79.7% |
| Moroccans | 66.7 /100 | #160 | Good 79.7% |
| South Africans | 66.2 /100 | #161 | Good 79.7% |
| Germans | 65.2 /100 | #162 | Good 79.7% |
| Immigrants | Costa Rica | 64.6 /100 | #163 | Good 79.7% |
| Immigrants | Burma/Myanmar | 64.4 /100 | #164 | Good 79.7% |
| Nigerians | 64.0 /100 | #165 | Good 79.7% |
| Okinawans | 62.7 /100 | #166 | Good 79.6% |
| Immigrants | Iraq | 62.0 /100 | #167 | Good 79.6% |
| Immigrants | Indonesia | 61.8 /100 | #168 | Good 79.6% |
| Laotians | 58.4 /100 | #169 | Average 79.6% |
Demographics Similar to Creek by In Labor Force | Age 20-64
In terms of in labor force | age 20-64, the demographic groups most similar to Creek are Sioux (75.0%, a difference of 0.18%), Kiowa (75.0%, a difference of 0.20%), Menominee (75.3%, a difference of 0.22%), Choctaw (75.4%, a difference of 0.36%), and Cheyenne (74.8%, a difference of 0.40%).
| Demographics | Rating | Rank | In Labor Force | Age 20-64 |
| Inupiat | 0.0 /100 | #319 | Tragic 76.1% |
| Yakama | 0.0 /100 | #320 | Tragic 75.8% |
| Seminole | 0.0 /100 | #321 | Tragic 75.5% |
| Dutch West Indians | 0.0 /100 | #322 | Tragic 75.5% |
| Cajuns | 0.0 /100 | #323 | Tragic 75.5% |
| Choctaw | 0.0 /100 | #324 | Tragic 75.4% |
| Menominee | 0.0 /100 | #325 | Tragic 75.3% |
| Creek | 0.0 /100 | #326 | Tragic 75.1% |
| Sioux | 0.0 /100 | #327 | Tragic 75.0% |
| Kiowa | 0.0 /100 | #328 | Tragic 75.0% |
| Cheyenne | 0.0 /100 | #329 | Tragic 74.8% |
| Colville | 0.0 /100 | #330 | Tragic 74.8% |
| Paiute | 0.0 /100 | #331 | Tragic 74.7% |
| Arapaho | 0.0 /100 | #332 | Tragic 74.4% |
| Natives/Alaskans | 0.0 /100 | #333 | Tragic 73.9% |