German vs Immigrants from Belarus 4 or more Vehicles in Household
COMPARE
German
Immigrants from Belarus
4 or more Vehicles in Household
4 or more Vehicles in Household Comparison
Germans
Immigrants from Belarus
7.5%
4 OR MORE VEHICLES IN HOUSEHOLD
99.9/ 100
METRIC RATING
69th/ 347
METRIC RANK
4.7%
4 OR MORE VEHICLES IN HOUSEHOLD
0.0/ 100
METRIC RATING
315th/ 347
METRIC RANK
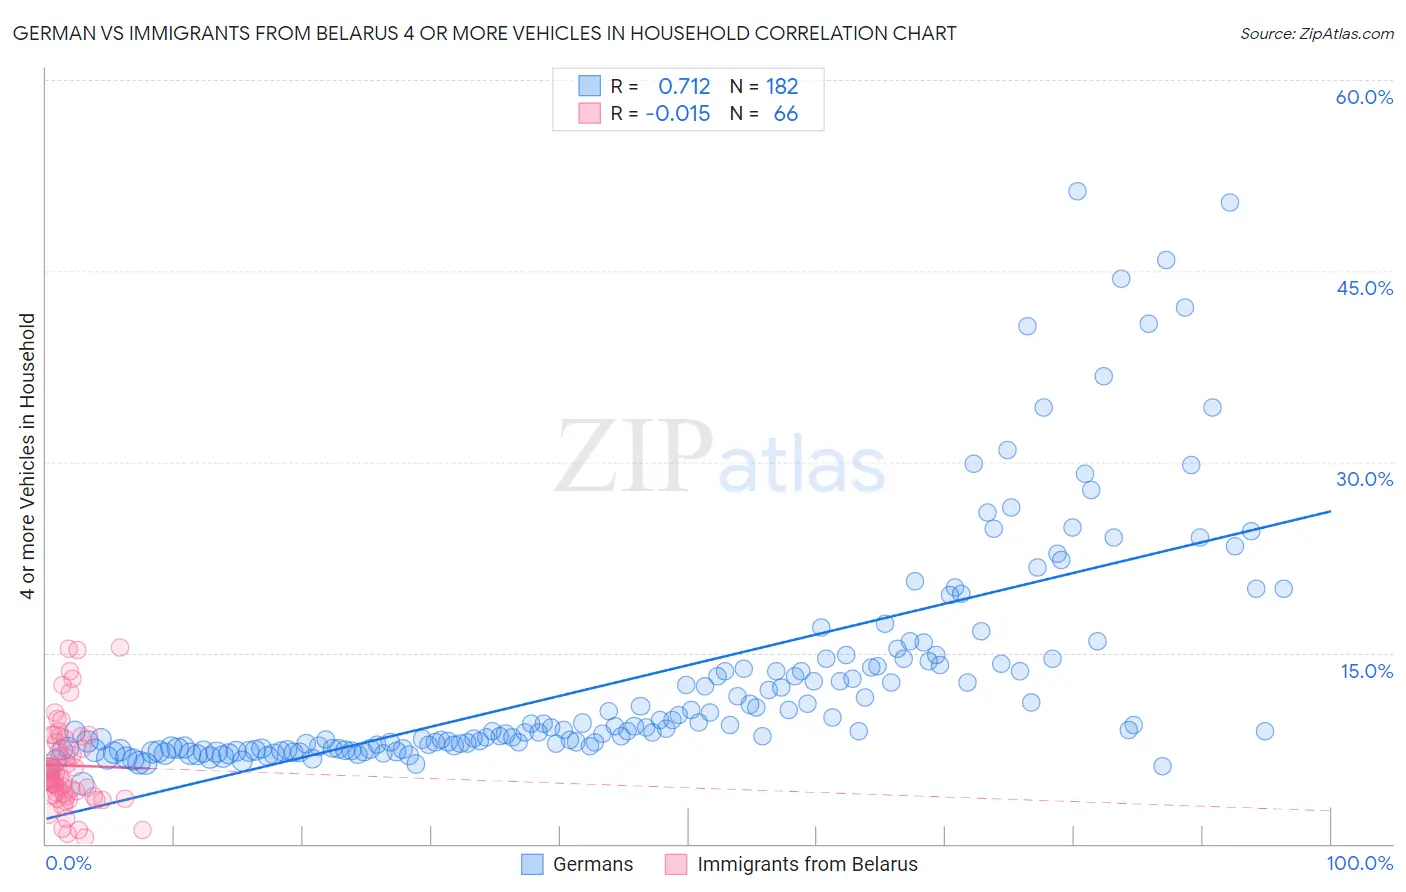
German vs Immigrants from Belarus 4 or more Vehicles in Household Correlation Chart
The statistical analysis conducted on geographies consisting of 576,875,838 people shows a strong positive correlation between the proportion of Germans and percentage of households with 4 or more vehicles available in the United States with a correlation coefficient (R) of 0.712 and weighted average of 7.5%. Similarly, the statistical analysis conducted on geographies consisting of 149,564,029 people shows no correlation between the proportion of Immigrants from Belarus and percentage of households with 4 or more vehicles available in the United States with a correlation coefficient (R) of -0.015 and weighted average of 4.7%, a difference of 57.2%.
4 or more Vehicles in Household Correlation Summary
| Measurement | German | Immigrants from Belarus |
| Minimum | 4.7% | 0.52% |
| Maximum | 51.2% | 15.4% |
| Range | 46.6% | 14.9% |
| Mean | 13.0% | 6.1% |
| Median | 9.0% | 5.3% |
| Interquartile 25% (IQ1) | 7.5% | 3.9% |
| Interquartile 75% (IQ3) | 14.1% | 8.2% |
| Interquartile Range (IQR) | 6.6% | 4.3% |
| Standard Deviation (Sample) | 9.1% | 3.5% |
| Standard Deviation (Population) | 9.0% | 3.5% |
Similar Demographics by 4 or more Vehicles in Household
Demographics Similar to Germans by 4 or more Vehicles in Household
In terms of 4 or more vehicles in household, the demographic groups most similar to Germans are Scottish (7.4%, a difference of 0.070%), Chickasaw (7.4%, a difference of 0.20%), Scotch-Irish (7.4%, a difference of 0.50%), Welsh (7.5%, a difference of 0.59%), and Portuguese (7.4%, a difference of 0.60%).
| Demographics | Rating | Rank | 4 or more Vehicles in Household |
| Chippewa | 100.0 /100 | #62 | Exceptional 7.6% |
| Immigrants | Micronesia | 100.0 /100 | #63 | Exceptional 7.6% |
| Bangladeshis | 100.0 /100 | #64 | Exceptional 7.6% |
| Immigrants | Azores | 100.0 /100 | #65 | Exceptional 7.5% |
| Immigrants | Taiwan | 99.9 /100 | #66 | Exceptional 7.5% |
| Americans | 99.9 /100 | #67 | Exceptional 7.5% |
| Welsh | 99.9 /100 | #68 | Exceptional 7.5% |
| Germans | 99.9 /100 | #69 | Exceptional 7.5% |
| Scottish | 99.9 /100 | #70 | Exceptional 7.4% |
| Chickasaw | 99.9 /100 | #71 | Exceptional 7.4% |
| Scotch-Irish | 99.9 /100 | #72 | Exceptional 7.4% |
| Portuguese | 99.9 /100 | #73 | Exceptional 7.4% |
| Icelanders | 99.9 /100 | #74 | Exceptional 7.4% |
| Immigrants | Cambodia | 99.9 /100 | #75 | Exceptional 7.4% |
| Laotians | 99.9 /100 | #76 | Exceptional 7.4% |
Demographics Similar to Immigrants from Belarus by 4 or more Vehicles in Household
In terms of 4 or more vehicles in household, the demographic groups most similar to Immigrants from Belarus are Immigrants from West Indies (4.7%, a difference of 0.090%), Puerto Rican (4.7%, a difference of 0.44%), Immigrants from Israel (4.8%, a difference of 0.88%), Albanian (4.8%, a difference of 0.90%), and U.S. Virgin Islander (4.6%, a difference of 2.1%).
| Demographics | Rating | Rank | 4 or more Vehicles in Household |
| Paraguayans | 0.0 /100 | #308 | Tragic 4.9% |
| Immigrants | Somalia | 0.0 /100 | #309 | Tragic 4.9% |
| Moroccans | 0.0 /100 | #310 | Tragic 4.9% |
| Houma | 0.0 /100 | #311 | Tragic 4.9% |
| Albanians | 0.0 /100 | #312 | Tragic 4.8% |
| Immigrants | Israel | 0.0 /100 | #313 | Tragic 4.8% |
| Immigrants | West Indies | 0.0 /100 | #314 | Tragic 4.7% |
| Immigrants | Belarus | 0.0 /100 | #315 | Tragic 4.7% |
| Puerto Ricans | 0.0 /100 | #316 | Tragic 4.7% |
| U.S. Virgin Islanders | 0.0 /100 | #317 | Tragic 4.6% |
| Jamaicans | 0.0 /100 | #318 | Tragic 4.6% |
| Haitians | 0.0 /100 | #319 | Tragic 4.6% |
| Immigrants | Haiti | 0.0 /100 | #320 | Tragic 4.5% |
| Ecuadorians | 0.0 /100 | #321 | Tragic 4.5% |
| Immigrants | Yemen | 0.0 /100 | #322 | Tragic 4.5% |