Sri Lankan vs Austrian 2 or more Vehicles in Household
COMPARE
Sri Lankan
Austrian
2 or more Vehicles in Household
2 or more Vehicles in Household Comparison
Sri Lankans
Austrians
61.0%
2 OR MORE VEHICLES IN HOUSEHOLD
100.0/ 100
METRIC RATING
20th/ 347
METRIC RANK
58.4%
2 OR MORE VEHICLES IN HOUSEHOLD
99.6/ 100
METRIC RATING
72nd/ 347
METRIC RANK
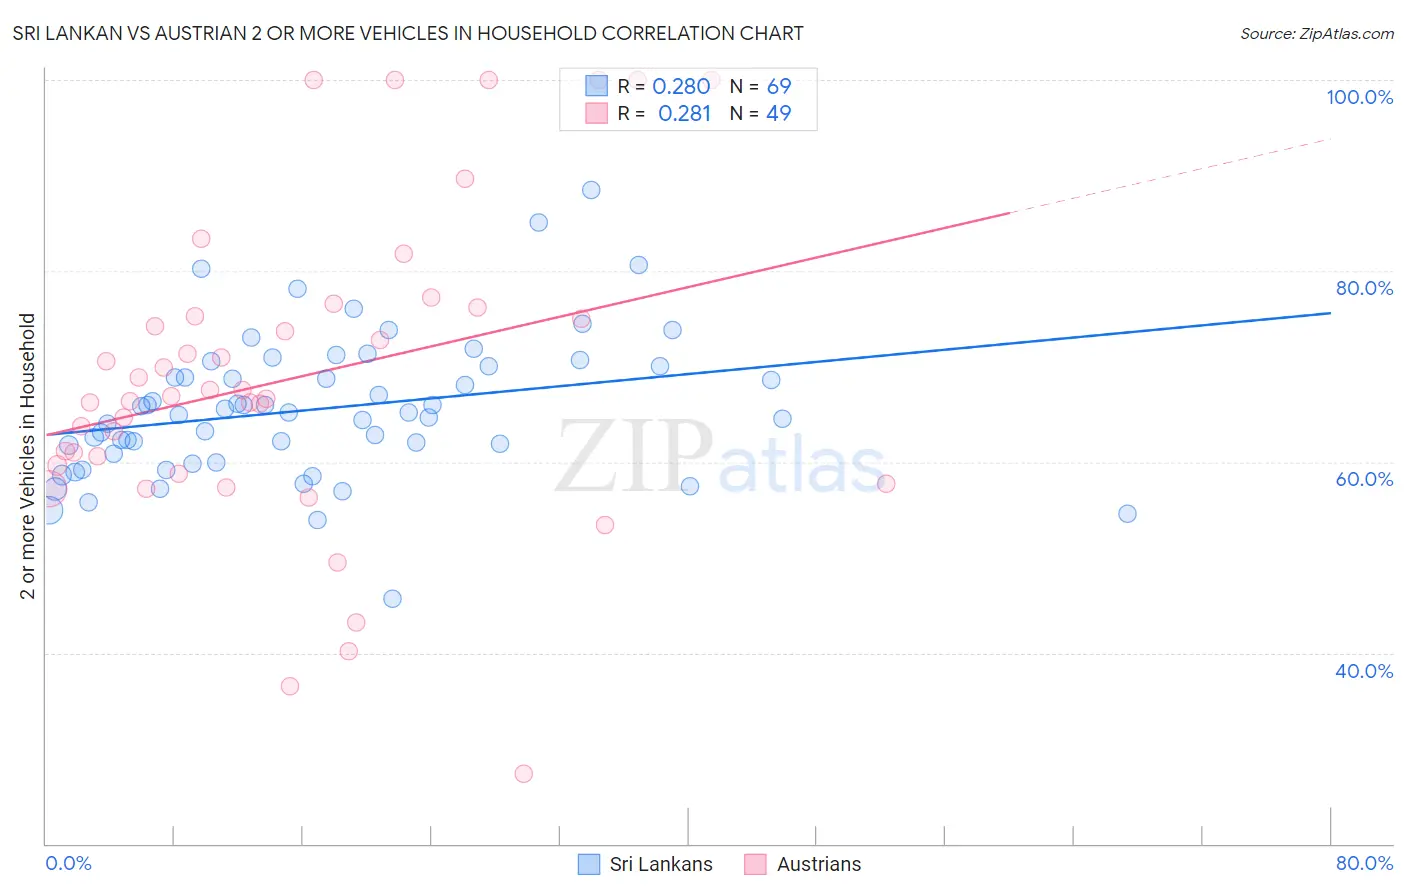
Sri Lankan vs Austrian 2 or more Vehicles in Household Correlation Chart
The statistical analysis conducted on geographies consisting of 440,160,009 people shows a weak positive correlation between the proportion of Sri Lankans and percentage of households with 2 or more vehicles available in the United States with a correlation coefficient (R) of 0.280 and weighted average of 61.0%. Similarly, the statistical analysis conducted on geographies consisting of 451,851,074 people shows a weak positive correlation between the proportion of Austrians and percentage of households with 2 or more vehicles available in the United States with a correlation coefficient (R) of 0.281 and weighted average of 58.4%, a difference of 4.5%.
2 or more Vehicles in Household Correlation Summary
| Measurement | Sri Lankan | Austrian |
| Minimum | 45.6% | 27.3% |
| Maximum | 88.5% | 100.0% |
| Range | 42.8% | 72.7% |
| Mean | 65.5% | 68.8% |
| Median | 65.1% | 66.8% |
| Interquartile 25% (IQ1) | 60.4% | 59.2% |
| Interquartile 75% (IQ3) | 70.0% | 75.7% |
| Interquartile Range (IQR) | 9.6% | 16.5% |
| Standard Deviation (Sample) | 7.5% | 16.5% |
| Standard Deviation (Population) | 7.4% | 16.3% |
Similar Demographics by 2 or more Vehicles in Household
Demographics Similar to Sri Lankans by 2 or more Vehicles in Household
In terms of 2 or more vehicles in household, the demographic groups most similar to Sri Lankans are Korean (61.0%, a difference of 0.040%), Swiss (61.0%, a difference of 0.080%), Scotch-Irish (60.9%, a difference of 0.12%), Immigrants from Vietnam (60.9%, a difference of 0.16%), and White/Caucasian (60.8%, a difference of 0.31%).
| Demographics | Rating | Rank | 2 or more Vehicles in Household |
| Samoans | 100.0 /100 | #13 | Exceptional 61.5% |
| Czechs | 100.0 /100 | #14 | Exceptional 61.5% |
| Nepalese | 100.0 /100 | #15 | Exceptional 61.4% |
| Native Hawaiians | 100.0 /100 | #16 | Exceptional 61.4% |
| Basques | 100.0 /100 | #17 | Exceptional 61.4% |
| Europeans | 100.0 /100 | #18 | Exceptional 61.4% |
| Scottish | 100.0 /100 | #19 | Exceptional 61.2% |
| Sri Lankans | 100.0 /100 | #20 | Exceptional 61.0% |
| Koreans | 100.0 /100 | #21 | Exceptional 61.0% |
| Swiss | 100.0 /100 | #22 | Exceptional 61.0% |
| Scotch-Irish | 100.0 /100 | #23 | Exceptional 60.9% |
| Immigrants | Vietnam | 100.0 /100 | #24 | Exceptional 60.9% |
| Whites/Caucasians | 100.0 /100 | #25 | Exceptional 60.8% |
| Welsh | 100.0 /100 | #26 | Exceptional 60.8% |
| Assyrians/Chaldeans/Syriacs | 100.0 /100 | #27 | Exceptional 60.5% |
Demographics Similar to Austrians by 2 or more Vehicles in Household
In terms of 2 or more vehicles in household, the demographic groups most similar to Austrians are Bangladeshi (58.4%, a difference of 0.030%), Italian (58.4%, a difference of 0.050%), Bolivian (58.3%, a difference of 0.12%), Immigrants from Afghanistan (58.3%, a difference of 0.13%), and Pennsylvania German (58.5%, a difference of 0.16%).
| Demographics | Rating | Rank | 2 or more Vehicles in Household |
| Immigrants | Central America | 99.7 /100 | #65 | Exceptional 58.6% |
| Croatians | 99.7 /100 | #66 | Exceptional 58.6% |
| Laotians | 99.7 /100 | #67 | Exceptional 58.6% |
| Canadians | 99.7 /100 | #68 | Exceptional 58.6% |
| Pennsylvania Germans | 99.7 /100 | #69 | Exceptional 58.5% |
| Italians | 99.6 /100 | #70 | Exceptional 58.4% |
| Bangladeshis | 99.6 /100 | #71 | Exceptional 58.4% |
| Austrians | 99.6 /100 | #72 | Exceptional 58.4% |
| Bolivians | 99.6 /100 | #73 | Exceptional 58.3% |
| Immigrants | Afghanistan | 99.6 /100 | #74 | Exceptional 58.3% |
| Poles | 99.5 /100 | #75 | Exceptional 58.3% |
| Creek | 99.5 /100 | #76 | Exceptional 58.3% |
| Slovenes | 99.5 /100 | #77 | Exceptional 58.3% |
| Lithuanians | 99.5 /100 | #78 | Exceptional 58.2% |
| Delaware | 99.4 /100 | #79 | Exceptional 58.2% |