Filipino vs Sudanese 4 or more Vehicles in Household
COMPARE
Filipino
Sudanese
4 or more Vehicles in Household
4 or more Vehicles in Household Comparison
Filipinos
Sudanese
6.9%
4 OR MORE VEHICLES IN HOUSEHOLD
97.6/ 100
METRIC RATING
109th/ 347
METRIC RANK
5.6%
4 OR MORE VEHICLES IN HOUSEHOLD
1.2/ 100
METRIC RATING
261st/ 347
METRIC RANK
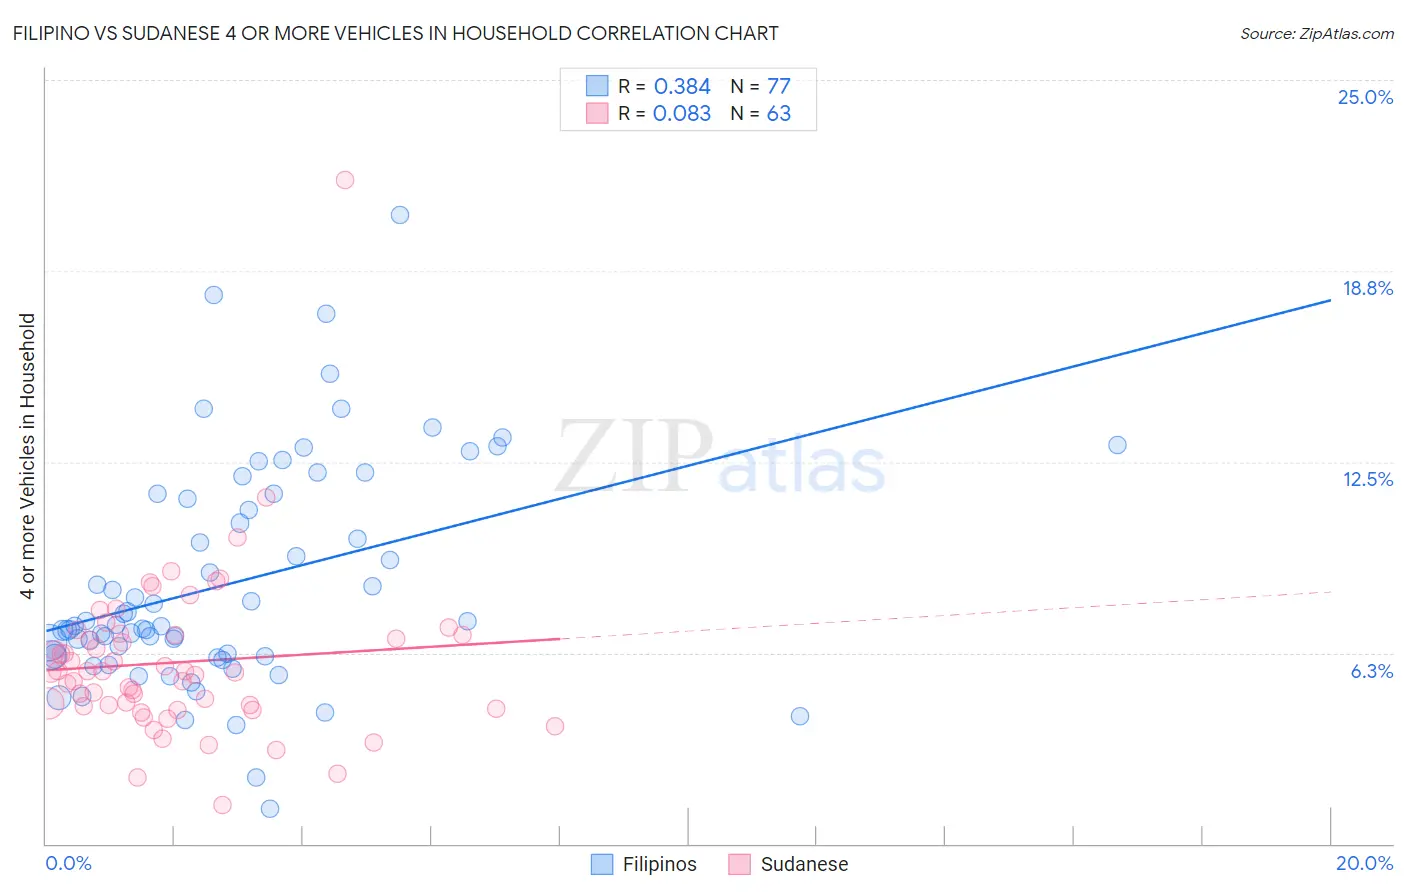
Filipino vs Sudanese 4 or more Vehicles in Household Correlation Chart
The statistical analysis conducted on geographies consisting of 252,798,218 people shows a mild positive correlation between the proportion of Filipinos and percentage of households with 4 or more vehicles available in the United States with a correlation coefficient (R) of 0.384 and weighted average of 6.9%. Similarly, the statistical analysis conducted on geographies consisting of 109,909,032 people shows a slight positive correlation between the proportion of Sudanese and percentage of households with 4 or more vehicles available in the United States with a correlation coefficient (R) of 0.083 and weighted average of 5.6%, a difference of 23.0%.
4 or more Vehicles in Household Correlation Summary
| Measurement | Filipino | Sudanese |
| Minimum | 1.2% | 1.3% |
| Maximum | 20.6% | 21.7% |
| Range | 19.4% | 20.5% |
| Mean | 8.5% | 5.9% |
| Median | 7.1% | 5.6% |
| Interquartile 25% (IQ1) | 6.1% | 4.5% |
| Interquartile 75% (IQ3) | 11.4% | 6.9% |
| Interquartile Range (IQR) | 5.2% | 2.3% |
| Standard Deviation (Sample) | 3.7% | 2.8% |
| Standard Deviation (Population) | 3.7% | 2.7% |
Similar Demographics by 4 or more Vehicles in Household
Demographics Similar to Filipinos by 4 or more Vehicles in Household
In terms of 4 or more vehicles in household, the demographic groups most similar to Filipinos are French (6.9%, a difference of 0.18%), Immigrants from Thailand (6.9%, a difference of 0.50%), Nicaraguan (7.0%, a difference of 0.52%), Guatemalan (7.0%, a difference of 0.53%), and Aleut (6.9%, a difference of 0.53%).
| Demographics | Rating | Rank | 4 or more Vehicles in Household |
| Asians | 98.6 /100 | #102 | Exceptional 7.0% |
| Blackfeet | 98.6 /100 | #103 | Exceptional 7.0% |
| Hmong | 98.3 /100 | #104 | Exceptional 7.0% |
| German Russians | 98.3 /100 | #105 | Exceptional 7.0% |
| Guatemalans | 98.1 /100 | #106 | Exceptional 7.0% |
| Nicaraguans | 98.0 /100 | #107 | Exceptional 7.0% |
| French | 97.7 /100 | #108 | Exceptional 6.9% |
| Filipinos | 97.6 /100 | #109 | Exceptional 6.9% |
| Immigrants | Thailand | 97.0 /100 | #110 | Exceptional 6.9% |
| Aleuts | 97.0 /100 | #111 | Exceptional 6.9% |
| Hopi | 97.0 /100 | #112 | Exceptional 6.9% |
| Canadians | 96.4 /100 | #113 | Exceptional 6.9% |
| Bolivians | 96.3 /100 | #114 | Exceptional 6.8% |
| Tlingit-Haida | 96.2 /100 | #115 | Exceptional 6.8% |
| Immigrants | Guatemala | 95.8 /100 | #116 | Exceptional 6.8% |
Demographics Similar to Sudanese by 4 or more Vehicles in Household
In terms of 4 or more vehicles in household, the demographic groups most similar to Sudanese are Uruguayan (5.6%, a difference of 0.090%), Bermudan (5.6%, a difference of 0.11%), Immigrants from Saudi Arabia (5.6%, a difference of 0.20%), Immigrants from France (5.6%, a difference of 0.27%), and Immigrants from Lithuania (5.6%, a difference of 0.30%).
| Demographics | Rating | Rank | 4 or more Vehicles in Household |
| Immigrants | Panama | 1.5 /100 | #254 | Tragic 5.7% |
| Yup'ik | 1.5 /100 | #255 | Tragic 5.7% |
| Immigrants | Turkey | 1.5 /100 | #256 | Tragic 5.7% |
| Immigrants | Northern Africa | 1.4 /100 | #257 | Tragic 5.6% |
| Immigrants | Lithuania | 1.4 /100 | #258 | Tragic 5.6% |
| Immigrants | France | 1.3 /100 | #259 | Tragic 5.6% |
| Uruguayans | 1.3 /100 | #260 | Tragic 5.6% |
| Sudanese | 1.2 /100 | #261 | Tragic 5.6% |
| Bermudans | 1.2 /100 | #262 | Tragic 5.6% |
| Immigrants | Saudi Arabia | 1.1 /100 | #263 | Tragic 5.6% |
| Immigrants | Africa | 1.0 /100 | #264 | Tragic 5.6% |
| South Americans | 0.9 /100 | #265 | Tragic 5.6% |
| Immigrants | Nepal | 0.9 /100 | #266 | Tragic 5.6% |
| Immigrants | Ukraine | 0.9 /100 | #267 | Tragic 5.6% |
| Colombians | 0.7 /100 | #268 | Tragic 5.5% |