Cree vs Sudanese 4 or more Vehicles in Household
COMPARE
Cree
Sudanese
4 or more Vehicles in Household
4 or more Vehicles in Household Comparison
Cree
Sudanese
7.2%
4 OR MORE VEHICLES IN HOUSEHOLD
99.7/ 100
METRIC RATING
85th/ 347
METRIC RANK
5.6%
4 OR MORE VEHICLES IN HOUSEHOLD
1.2/ 100
METRIC RATING
261st/ 347
METRIC RANK
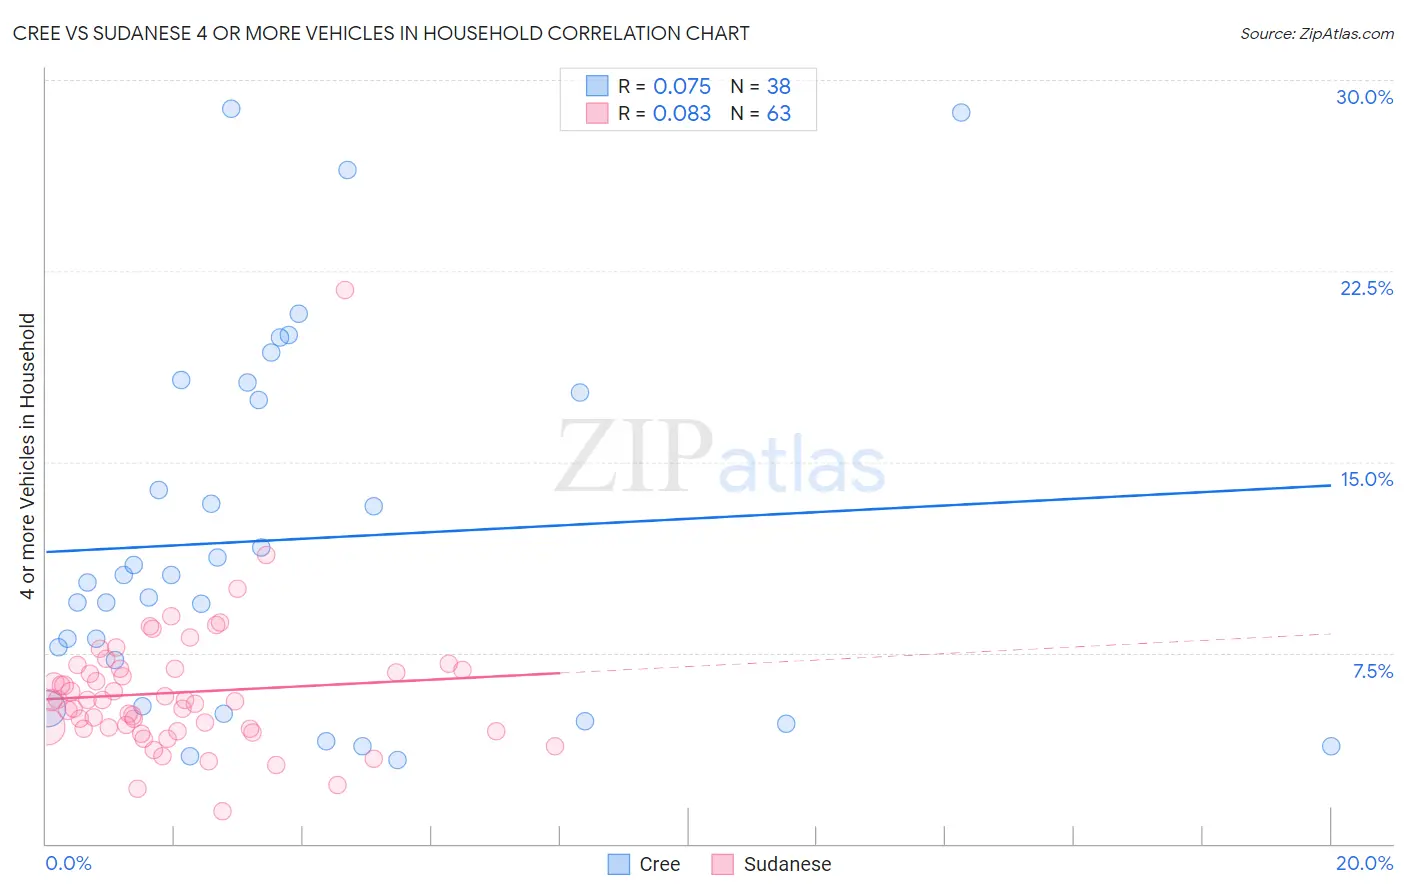
Cree vs Sudanese 4 or more Vehicles in Household Correlation Chart
The statistical analysis conducted on geographies consisting of 76,129,414 people shows a slight positive correlation between the proportion of Cree and percentage of households with 4 or more vehicles available in the United States with a correlation coefficient (R) of 0.075 and weighted average of 7.2%. Similarly, the statistical analysis conducted on geographies consisting of 109,909,032 people shows a slight positive correlation between the proportion of Sudanese and percentage of households with 4 or more vehicles available in the United States with a correlation coefficient (R) of 0.083 and weighted average of 5.6%, a difference of 28.8%.
4 or more Vehicles in Household Correlation Summary
| Measurement | Cree | Sudanese |
| Minimum | 3.3% | 1.3% |
| Maximum | 28.9% | 21.7% |
| Range | 25.5% | 20.5% |
| Mean | 11.9% | 5.9% |
| Median | 10.4% | 5.6% |
| Interquartile 25% (IQ1) | 5.4% | 4.5% |
| Interquartile 75% (IQ3) | 17.7% | 6.9% |
| Interquartile Range (IQR) | 12.3% | 2.3% |
| Standard Deviation (Sample) | 7.1% | 2.8% |
| Standard Deviation (Population) | 7.0% | 2.7% |
Similar Demographics by 4 or more Vehicles in Household
Demographics Similar to Cree by 4 or more Vehicles in Household
In terms of 4 or more vehicles in household, the demographic groups most similar to Cree are Afghan (7.3%, a difference of 0.17%), Immigrants from Indonesia (7.2%, a difference of 0.18%), Delaware (7.2%, a difference of 0.24%), Nonimmigrants (7.2%, a difference of 0.26%), and Potawatomi (7.3%, a difference of 0.49%).
| Demographics | Rating | Rank | 4 or more Vehicles in Household |
| Whites/Caucasians | 99.8 /100 | #78 | Exceptional 7.4% |
| Czechs | 99.8 /100 | #79 | Exceptional 7.4% |
| Alaska Natives | 99.8 /100 | #80 | Exceptional 7.3% |
| Finns | 99.8 /100 | #81 | Exceptional 7.3% |
| Northern Europeans | 99.8 /100 | #82 | Exceptional 7.3% |
| Potawatomi | 99.7 /100 | #83 | Exceptional 7.3% |
| Afghans | 99.7 /100 | #84 | Exceptional 7.3% |
| Cree | 99.7 /100 | #85 | Exceptional 7.2% |
| Immigrants | Indonesia | 99.6 /100 | #86 | Exceptional 7.2% |
| Delaware | 99.6 /100 | #87 | Exceptional 7.2% |
| Immigrants | Nonimmigrants | 99.6 /100 | #88 | Exceptional 7.2% |
| British | 99.6 /100 | #89 | Exceptional 7.2% |
| Creek | 99.6 /100 | #90 | Exceptional 7.2% |
| Assyrians/Chaldeans/Syriacs | 99.4 /100 | #91 | Exceptional 7.2% |
| Immigrants | Latin America | 99.4 /100 | #92 | Exceptional 7.1% |
Demographics Similar to Sudanese by 4 or more Vehicles in Household
In terms of 4 or more vehicles in household, the demographic groups most similar to Sudanese are Uruguayan (5.6%, a difference of 0.090%), Bermudan (5.6%, a difference of 0.11%), Immigrants from Saudi Arabia (5.6%, a difference of 0.20%), Immigrants from France (5.6%, a difference of 0.27%), and Immigrants from Lithuania (5.6%, a difference of 0.30%).
| Demographics | Rating | Rank | 4 or more Vehicles in Household |
| Immigrants | Panama | 1.5 /100 | #254 | Tragic 5.7% |
| Yup'ik | 1.5 /100 | #255 | Tragic 5.7% |
| Immigrants | Turkey | 1.5 /100 | #256 | Tragic 5.7% |
| Immigrants | Northern Africa | 1.4 /100 | #257 | Tragic 5.6% |
| Immigrants | Lithuania | 1.4 /100 | #258 | Tragic 5.6% |
| Immigrants | France | 1.3 /100 | #259 | Tragic 5.6% |
| Uruguayans | 1.3 /100 | #260 | Tragic 5.6% |
| Sudanese | 1.2 /100 | #261 | Tragic 5.6% |
| Bermudans | 1.2 /100 | #262 | Tragic 5.6% |
| Immigrants | Saudi Arabia | 1.1 /100 | #263 | Tragic 5.6% |
| Immigrants | Africa | 1.0 /100 | #264 | Tragic 5.6% |
| South Americans | 0.9 /100 | #265 | Tragic 5.6% |
| Immigrants | Nepal | 0.9 /100 | #266 | Tragic 5.6% |
| Immigrants | Ukraine | 0.9 /100 | #267 | Tragic 5.6% |
| Colombians | 0.7 /100 | #268 | Tragic 5.5% |