Filipino vs Choctaw 4 or more Vehicles in Household
COMPARE
Filipino
Choctaw
4 or more Vehicles in Household
4 or more Vehicles in Household Comparison
Filipinos
Choctaw
6.9%
4 OR MORE VEHICLES IN HOUSEHOLD
97.6/ 100
METRIC RATING
109th/ 347
METRIC RANK
7.8%
4 OR MORE VEHICLES IN HOUSEHOLD
100.0/ 100
METRIC RATING
45th/ 347
METRIC RANK
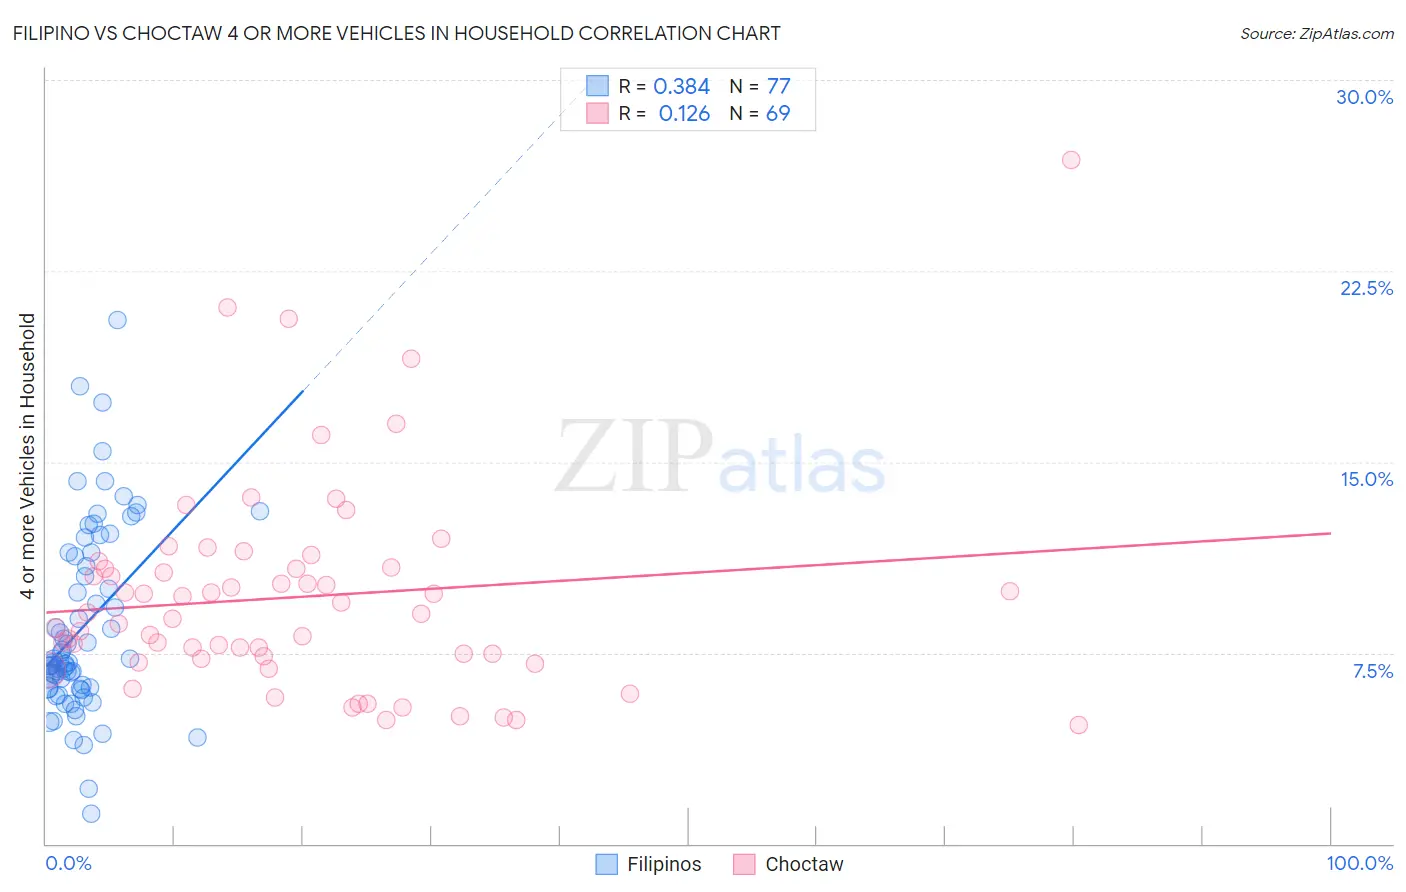
Filipino vs Choctaw 4 or more Vehicles in Household Correlation Chart
The statistical analysis conducted on geographies consisting of 252,798,218 people shows a mild positive correlation between the proportion of Filipinos and percentage of households with 4 or more vehicles available in the United States with a correlation coefficient (R) of 0.384 and weighted average of 6.9%. Similarly, the statistical analysis conducted on geographies consisting of 269,154,664 people shows a poor positive correlation between the proportion of Choctaw and percentage of households with 4 or more vehicles available in the United States with a correlation coefficient (R) of 0.126 and weighted average of 7.8%, a difference of 12.7%.
4 or more Vehicles in Household Correlation Summary
| Measurement | Filipino | Choctaw |
| Minimum | 1.2% | 4.7% |
| Maximum | 20.6% | 26.9% |
| Range | 19.4% | 22.2% |
| Mean | 8.5% | 9.7% |
| Median | 7.1% | 9.0% |
| Interquartile 25% (IQ1) | 6.1% | 7.3% |
| Interquartile 75% (IQ3) | 11.4% | 10.8% |
| Interquartile Range (IQR) | 5.2% | 3.5% |
| Standard Deviation (Sample) | 3.7% | 4.1% |
| Standard Deviation (Population) | 3.7% | 4.0% |
Similar Demographics by 4 or more Vehicles in Household
Demographics Similar to Filipinos by 4 or more Vehicles in Household
In terms of 4 or more vehicles in household, the demographic groups most similar to Filipinos are French (6.9%, a difference of 0.18%), Immigrants from Thailand (6.9%, a difference of 0.50%), Nicaraguan (7.0%, a difference of 0.52%), Guatemalan (7.0%, a difference of 0.53%), and Aleut (6.9%, a difference of 0.53%).
| Demographics | Rating | Rank | 4 or more Vehicles in Household |
| Asians | 98.6 /100 | #102 | Exceptional 7.0% |
| Blackfeet | 98.6 /100 | #103 | Exceptional 7.0% |
| Hmong | 98.3 /100 | #104 | Exceptional 7.0% |
| German Russians | 98.3 /100 | #105 | Exceptional 7.0% |
| Guatemalans | 98.1 /100 | #106 | Exceptional 7.0% |
| Nicaraguans | 98.0 /100 | #107 | Exceptional 7.0% |
| French | 97.7 /100 | #108 | Exceptional 6.9% |
| Filipinos | 97.6 /100 | #109 | Exceptional 6.9% |
| Immigrants | Thailand | 97.0 /100 | #110 | Exceptional 6.9% |
| Aleuts | 97.0 /100 | #111 | Exceptional 6.9% |
| Hopi | 97.0 /100 | #112 | Exceptional 6.9% |
| Canadians | 96.4 /100 | #113 | Exceptional 6.9% |
| Bolivians | 96.3 /100 | #114 | Exceptional 6.8% |
| Tlingit-Haida | 96.2 /100 | #115 | Exceptional 6.8% |
| Immigrants | Guatemala | 95.8 /100 | #116 | Exceptional 6.8% |
Demographics Similar to Choctaw by 4 or more Vehicles in Household
In terms of 4 or more vehicles in household, the demographic groups most similar to Choctaw are Bhutanese (7.8%, a difference of 0.050%), Crow (7.8%, a difference of 0.17%), Fijian (7.8%, a difference of 0.31%), Osage (7.8%, a difference of 0.33%), and Salvadoran (7.8%, a difference of 0.43%).
| Demographics | Rating | Rank | 4 or more Vehicles in Household |
| Sioux | 100.0 /100 | #38 | Exceptional 8.0% |
| Spanish Americans | 100.0 /100 | #39 | Exceptional 8.0% |
| Spanish | 100.0 /100 | #40 | Exceptional 7.9% |
| Pima | 100.0 /100 | #41 | Exceptional 7.9% |
| Salvadorans | 100.0 /100 | #42 | Exceptional 7.8% |
| Fijians | 100.0 /100 | #43 | Exceptional 7.8% |
| Bhutanese | 100.0 /100 | #44 | Exceptional 7.8% |
| Choctaw | 100.0 /100 | #45 | Exceptional 7.8% |
| Crow | 100.0 /100 | #46 | Exceptional 7.8% |
| Osage | 100.0 /100 | #47 | Exceptional 7.8% |
| Swiss | 100.0 /100 | #48 | Exceptional 7.8% |
| Cherokee | 100.0 /100 | #49 | Exceptional 7.7% |
| Immigrants | El Salvador | 100.0 /100 | #50 | Exceptional 7.7% |
| Immigrants | Laos | 100.0 /100 | #51 | Exceptional 7.7% |
| Japanese | 100.0 /100 | #52 | Exceptional 7.7% |