Filipino vs Sudanese Female Poverty
COMPARE
Filipino
Sudanese
Female Poverty
Female Poverty Comparison
Filipinos
Sudanese
10.9%
FEMALE POVERTY
100.0/ 100
METRIC RATING
5th/ 347
METRIC RANK
15.2%
FEMALE POVERTY
0.5/ 100
METRIC RATING
240th/ 347
METRIC RANK
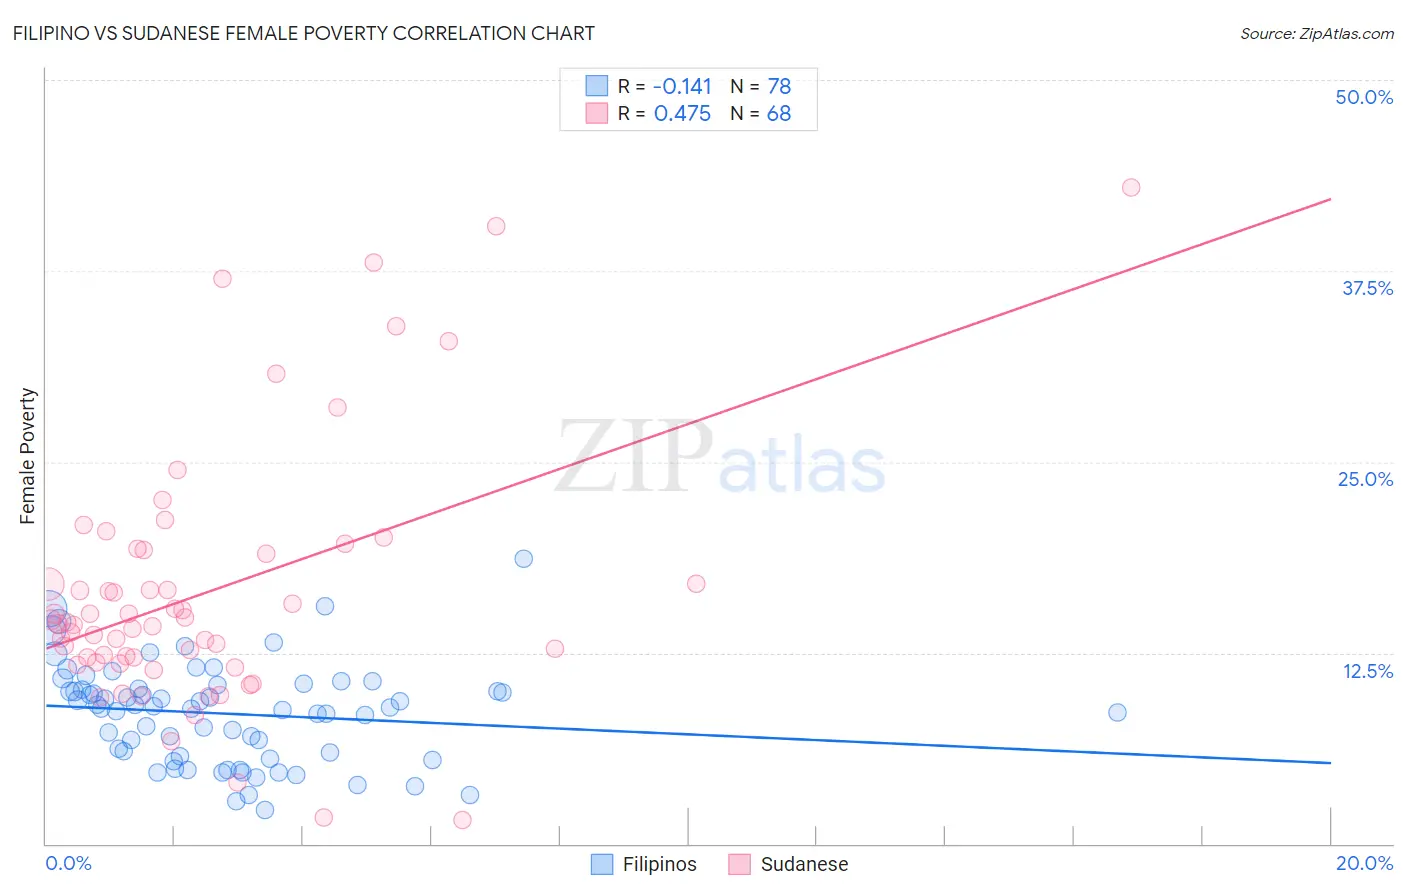
Filipino vs Sudanese Female Poverty Correlation Chart
The statistical analysis conducted on geographies consisting of 254,106,597 people shows a poor negative correlation between the proportion of Filipinos and poverty level among females in the United States with a correlation coefficient (R) of -0.141 and weighted average of 10.9%. Similarly, the statistical analysis conducted on geographies consisting of 110,113,357 people shows a moderate positive correlation between the proportion of Sudanese and poverty level among females in the United States with a correlation coefficient (R) of 0.475 and weighted average of 15.2%, a difference of 38.6%.
Female Poverty Correlation Summary
| Measurement | Filipino | Sudanese |
| Minimum | 2.2% | 1.6% |
| Maximum | 18.6% | 43.0% |
| Range | 16.4% | 41.4% |
| Mean | 8.5% | 16.5% |
| Median | 8.9% | 14.4% |
| Interquartile 25% (IQ1) | 5.7% | 12.0% |
| Interquartile 75% (IQ3) | 10.2% | 19.1% |
| Interquartile Range (IQR) | 4.4% | 7.1% |
| Standard Deviation (Sample) | 3.3% | 8.3% |
| Standard Deviation (Population) | 3.2% | 8.3% |
Similar Demographics by Female Poverty
Demographics Similar to Filipinos by Female Poverty
In terms of female poverty, the demographic groups most similar to Filipinos are Immigrants from Ireland (11.0%, a difference of 0.38%), Assyrian/Chaldean/Syriac (11.0%, a difference of 0.75%), Immigrants from South Central Asia (11.1%, a difference of 1.5%), Bulgarian (11.1%, a difference of 1.7%), and Immigrants from Hong Kong (11.2%, a difference of 2.5%).
| Demographics | Rating | Rank | Female Poverty |
| Immigrants | India | 100.0 /100 | #1 | Exceptional 9.9% |
| Chinese | 100.0 /100 | #2 | Exceptional 10.4% |
| Thais | 100.0 /100 | #3 | Exceptional 10.5% |
| Immigrants | Taiwan | 100.0 /100 | #4 | Exceptional 10.5% |
| Filipinos | 100.0 /100 | #5 | Exceptional 10.9% |
| Immigrants | Ireland | 99.9 /100 | #6 | Exceptional 11.0% |
| Assyrians/Chaldeans/Syriacs | 99.9 /100 | #7 | Exceptional 11.0% |
| Immigrants | South Central Asia | 99.9 /100 | #8 | Exceptional 11.1% |
| Bulgarians | 99.9 /100 | #9 | Exceptional 11.1% |
| Immigrants | Hong Kong | 99.9 /100 | #10 | Exceptional 11.2% |
| Maltese | 99.9 /100 | #11 | Exceptional 11.2% |
| Bhutanese | 99.9 /100 | #12 | Exceptional 11.3% |
| Immigrants | Lithuania | 99.9 /100 | #13 | Exceptional 11.3% |
| Lithuanians | 99.8 /100 | #14 | Exceptional 11.4% |
| Latvians | 99.8 /100 | #15 | Exceptional 11.4% |
Demographics Similar to Sudanese by Female Poverty
In terms of female poverty, the demographic groups most similar to Sudanese are Immigrants from Middle Africa (15.2%, a difference of 0.050%), Immigrants from Sudan (15.2%, a difference of 0.25%), Nepalese (15.2%, a difference of 0.37%), Immigrants from Armenia (15.1%, a difference of 0.57%), and Nicaraguan (15.3%, a difference of 0.61%).
| Demographics | Rating | Rank | Female Poverty |
| Immigrants | Saudi Arabia | 1.4 /100 | #233 | Tragic 14.8% |
| Fijians | 1.1 /100 | #234 | Tragic 14.9% |
| Immigrants | Laos | 0.9 /100 | #235 | Tragic 15.0% |
| Cree | 0.7 /100 | #236 | Tragic 15.1% |
| French American Indians | 0.6 /100 | #237 | Tragic 15.1% |
| Immigrants | Armenia | 0.6 /100 | #238 | Tragic 15.1% |
| Immigrants | Middle Africa | 0.5 /100 | #239 | Tragic 15.2% |
| Sudanese | 0.5 /100 | #240 | Tragic 15.2% |
| Immigrants | Sudan | 0.4 /100 | #241 | Tragic 15.2% |
| Nepalese | 0.4 /100 | #242 | Tragic 15.2% |
| Nicaraguans | 0.3 /100 | #243 | Tragic 15.3% |
| Ecuadorians | 0.3 /100 | #244 | Tragic 15.3% |
| Spanish American Indians | 0.3 /100 | #245 | Tragic 15.3% |
| Cubans | 0.3 /100 | #246 | Tragic 15.3% |
| Potawatomi | 0.3 /100 | #247 | Tragic 15.3% |