Estonian vs Afghan College, Under 1 year
COMPARE
Estonian
Afghan
College, Under 1 year
College, Under 1 year Comparison
Estonians
Afghans
70.6%
COLLEGE, UNDER 1 YEAR
99.9/ 100
METRIC RATING
34th/ 347
METRIC RANK
67.8%
COLLEGE, UNDER 1 YEAR
96.6/ 100
METRIC RATING
105th/ 347
METRIC RANK
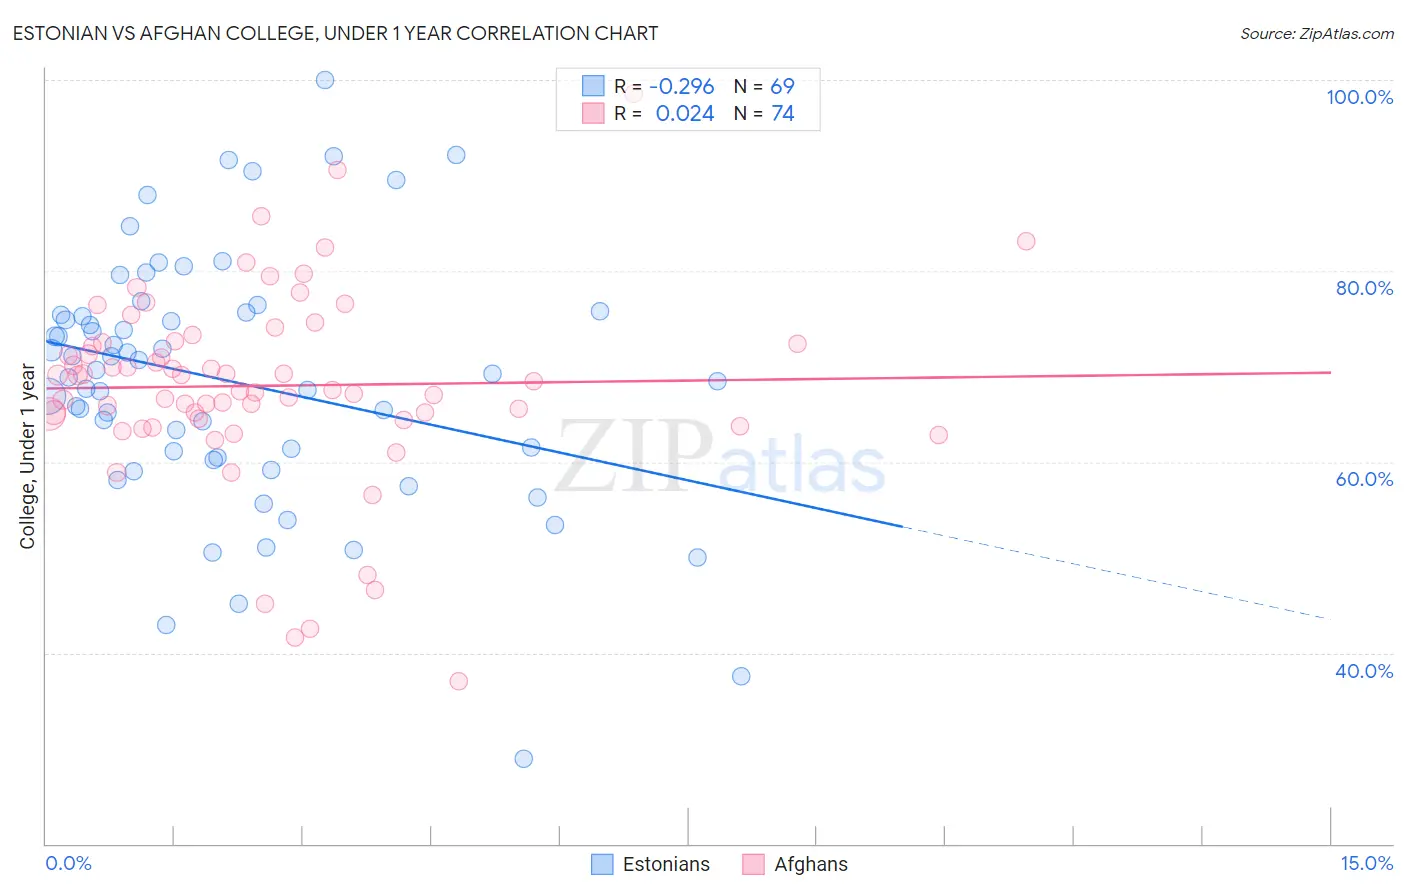
Estonian vs Afghan College, Under 1 year Correlation Chart
The statistical analysis conducted on geographies consisting of 123,528,478 people shows a weak negative correlation between the proportion of Estonians and percentage of population with at least college, under 1 year education in the United States with a correlation coefficient (R) of -0.296 and weighted average of 70.6%. Similarly, the statistical analysis conducted on geographies consisting of 148,874,947 people shows no correlation between the proportion of Afghans and percentage of population with at least college, under 1 year education in the United States with a correlation coefficient (R) of 0.024 and weighted average of 67.8%, a difference of 4.1%.
College, Under 1 year Correlation Summary
| Measurement | Estonian | Afghan |
| Minimum | 28.9% | 37.1% |
| Maximum | 100.0% | 98.6% |
| Range | 71.1% | 61.5% |
| Mean | 68.4% | 68.0% |
| Median | 69.2% | 68.0% |
| Interquartile 25% (IQ1) | 60.4% | 64.5% |
| Interquartile 75% (IQ3) | 75.5% | 72.5% |
| Interquartile Range (IQR) | 15.1% | 8.0% |
| Standard Deviation (Sample) | 13.3% | 10.2% |
| Standard Deviation (Population) | 13.2% | 10.2% |
Similar Demographics by College, Under 1 year
Demographics Similar to Estonians by College, Under 1 year
In terms of college, under 1 year, the demographic groups most similar to Estonians are Immigrants from South Africa (70.6%, a difference of 0.020%), Russian (70.5%, a difference of 0.080%), Immigrants from Sri Lanka (70.5%, a difference of 0.15%), Turkish (70.7%, a difference of 0.18%), and Immigrants from Saudi Arabia (70.4%, a difference of 0.26%).
| Demographics | Rating | Rank | College, Under 1 year |
| Immigrants | Ireland | 100.0 /100 | #27 | Exceptional 71.0% |
| Immigrants | Hong Kong | 100.0 /100 | #28 | Exceptional 71.0% |
| Immigrants | France | 100.0 /100 | #29 | Exceptional 71.0% |
| Immigrants | China | 99.9 /100 | #30 | Exceptional 70.9% |
| Indians (Asian) | 99.9 /100 | #31 | Exceptional 70.8% |
| Turks | 99.9 /100 | #32 | Exceptional 70.7% |
| Immigrants | South Africa | 99.9 /100 | #33 | Exceptional 70.6% |
| Estonians | 99.9 /100 | #34 | Exceptional 70.6% |
| Russians | 99.9 /100 | #35 | Exceptional 70.5% |
| Immigrants | Sri Lanka | 99.9 /100 | #36 | Exceptional 70.5% |
| Immigrants | Saudi Arabia | 99.9 /100 | #37 | Exceptional 70.4% |
| Australians | 99.9 /100 | #38 | Exceptional 70.4% |
| Bhutanese | 99.9 /100 | #39 | Exceptional 70.3% |
| Immigrants | Turkey | 99.9 /100 | #40 | Exceptional 70.3% |
| Immigrants | Kuwait | 99.9 /100 | #41 | Exceptional 70.3% |
Demographics Similar to Afghans by College, Under 1 year
In terms of college, under 1 year, the demographic groups most similar to Afghans are Immigrants from Western Asia (67.8%, a difference of 0.0%), Immigrants from Croatia (67.8%, a difference of 0.010%), Austrian (67.8%, a difference of 0.070%), Palestinian (67.9%, a difference of 0.080%), and Carpatho Rusyn (67.9%, a difference of 0.080%).
| Demographics | Rating | Rank | College, Under 1 year |
| Paraguayans | 97.1 /100 | #98 | Exceptional 67.9% |
| Immigrants | Bolivia | 97.0 /100 | #99 | Exceptional 67.9% |
| Immigrants | Argentina | 97.0 /100 | #100 | Exceptional 67.9% |
| Immigrants | Eastern Europe | 96.9 /100 | #101 | Exceptional 67.9% |
| Palestinians | 96.9 /100 | #102 | Exceptional 67.9% |
| Carpatho Rusyns | 96.8 /100 | #103 | Exceptional 67.9% |
| Immigrants | Western Asia | 96.6 /100 | #104 | Exceptional 67.8% |
| Afghans | 96.6 /100 | #105 | Exceptional 67.8% |
| Immigrants | Croatia | 96.6 /100 | #106 | Exceptional 67.8% |
| Austrians | 96.4 /100 | #107 | Exceptional 67.8% |
| Immigrants | Egypt | 96.0 /100 | #108 | Exceptional 67.7% |
| Scandinavians | 95.8 /100 | #109 | Exceptional 67.7% |
| Assyrians/Chaldeans/Syriacs | 95.8 /100 | #110 | Exceptional 67.7% |
| Ukrainians | 95.8 /100 | #111 | Exceptional 67.7% |
| Macedonians | 95.7 /100 | #112 | Exceptional 67.6% |