Egyptian vs Thai 1 or more Vehicles in Household
COMPARE
Egyptian
Thai
1 or more Vehicles in Household
1 or more Vehicles in Household Comparison
Egyptians
Thais
88.2%
1 OR MORE VEHICLES IN HOUSEHOLD
1.2/ 100
METRIC RATING
250th/ 347
METRIC RANK
91.9%
1 OR MORE VEHICLES IN HOUSEHOLD
99.8/ 100
METRIC RATING
62nd/ 347
METRIC RANK
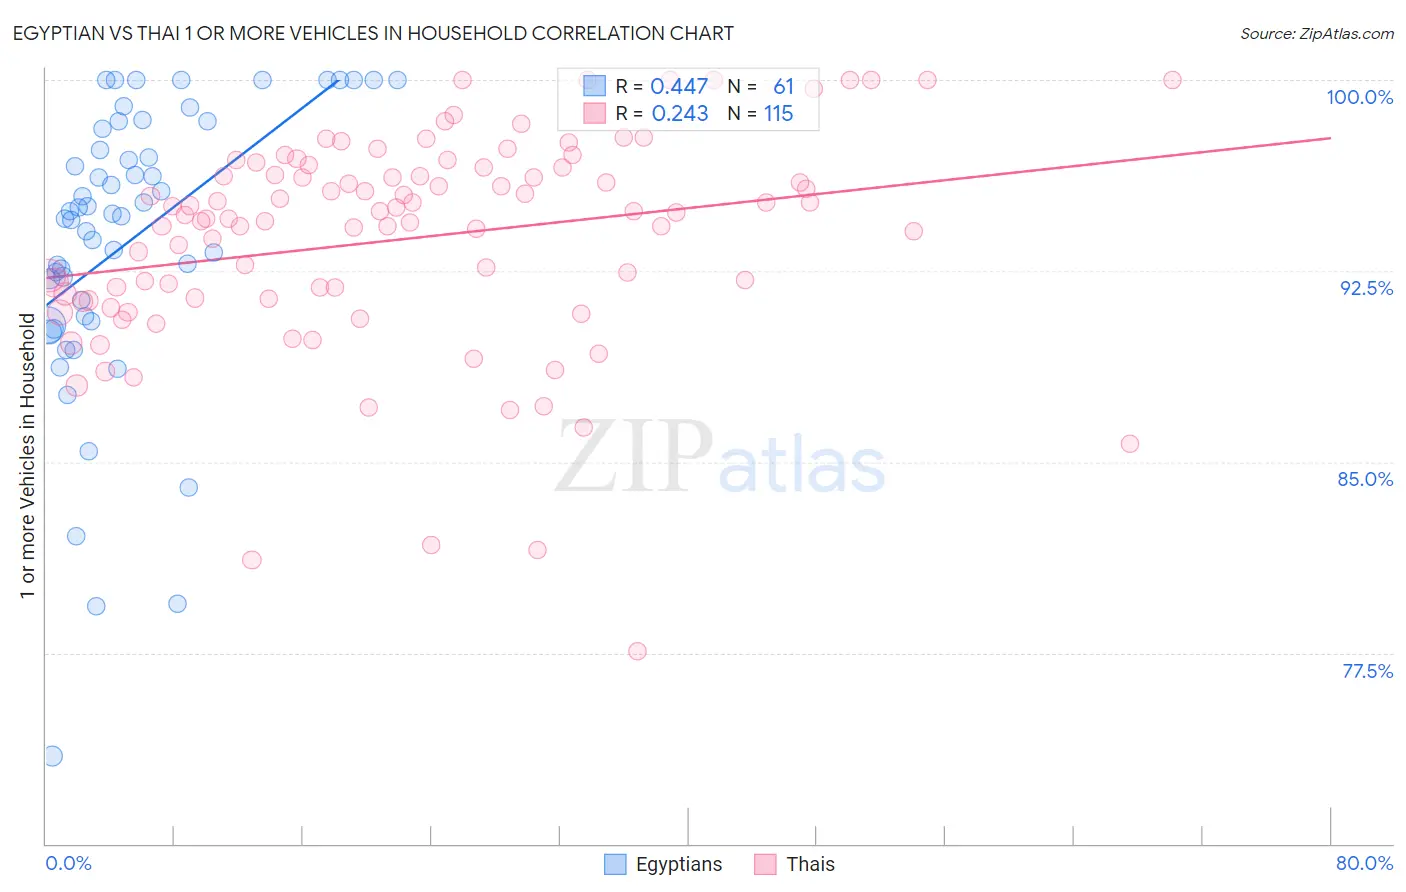
Egyptian vs Thai 1 or more Vehicles in Household Correlation Chart
The statistical analysis conducted on geographies consisting of 276,665,499 people shows a moderate positive correlation between the proportion of Egyptians and percentage of households with 1 or more vehicles available in the United States with a correlation coefficient (R) of 0.447 and weighted average of 88.2%. Similarly, the statistical analysis conducted on geographies consisting of 456,543,846 people shows a weak positive correlation between the proportion of Thais and percentage of households with 1 or more vehicles available in the United States with a correlation coefficient (R) of 0.243 and weighted average of 91.9%, a difference of 4.2%.
1 or more Vehicles in Household Correlation Summary
| Measurement | Egyptian | Thai |
| Minimum | 73.5% | 77.6% |
| Maximum | 100.0% | 100.0% |
| Range | 26.5% | 22.4% |
| Mean | 93.7% | 93.8% |
| Median | 94.7% | 94.7% |
| Interquartile 25% (IQ1) | 90.6% | 91.4% |
| Interquartile 75% (IQ3) | 98.2% | 96.6% |
| Interquartile Range (IQR) | 7.6% | 5.1% |
| Standard Deviation (Sample) | 5.7% | 4.2% |
| Standard Deviation (Population) | 5.6% | 4.2% |
Similar Demographics by 1 or more Vehicles in Household
Demographics Similar to Egyptians by 1 or more Vehicles in Household
In terms of 1 or more vehicles in household, the demographic groups most similar to Egyptians are Immigrants from Serbia (88.2%, a difference of 0.010%), Black/African American (88.2%, a difference of 0.040%), Immigrants from Uruguay (88.1%, a difference of 0.060%), Immigrants from Nigeria (88.2%, a difference of 0.090%), and Honduran (88.1%, a difference of 0.10%).
| Demographics | Rating | Rank | 1 or more Vehicles in Household |
| Immigrants | Belgium | 2.1 /100 | #243 | Tragic 88.4% |
| Immigrants | Portugal | 2.0 /100 | #244 | Tragic 88.3% |
| Immigrants | Czechoslovakia | 1.9 /100 | #245 | Tragic 88.3% |
| Menominee | 1.9 /100 | #246 | Tragic 88.3% |
| Immigrants | Honduras | 1.7 /100 | #247 | Tragic 88.3% |
| Immigrants | Nigeria | 1.5 /100 | #248 | Tragic 88.2% |
| Blacks/African Americans | 1.4 /100 | #249 | Tragic 88.2% |
| Egyptians | 1.2 /100 | #250 | Tragic 88.2% |
| Immigrants | Serbia | 1.2 /100 | #251 | Tragic 88.2% |
| Immigrants | Uruguay | 1.1 /100 | #252 | Tragic 88.1% |
| Hondurans | 1.0 /100 | #253 | Tragic 88.1% |
| Haitians | 0.9 /100 | #254 | Tragic 88.1% |
| Immigrants | Latvia | 0.9 /100 | #255 | Tragic 88.1% |
| Colombians | 0.9 /100 | #256 | Tragic 88.0% |
| Liberians | 0.9 /100 | #257 | Tragic 88.0% |
Demographics Similar to Thais by 1 or more Vehicles in Household
In terms of 1 or more vehicles in household, the demographic groups most similar to Thais are Immigrants from India (91.9%, a difference of 0.0%), Slovak (91.9%, a difference of 0.020%), Chinese (91.9%, a difference of 0.020%), Croatian (91.9%, a difference of 0.030%), and Venezuelan (91.9%, a difference of 0.040%).
| Demographics | Rating | Rank | 1 or more Vehicles in Household |
| Immigrants | Afghanistan | 99.9 /100 | #55 | Exceptional 92.0% |
| Immigrants | Venezuela | 99.9 /100 | #56 | Exceptional 92.0% |
| Iraqis | 99.8 /100 | #57 | Exceptional 91.9% |
| Immigrants | Mexico | 99.8 /100 | #58 | Exceptional 91.9% |
| Venezuelans | 99.8 /100 | #59 | Exceptional 91.9% |
| Slovaks | 99.8 /100 | #60 | Exceptional 91.9% |
| Immigrants | India | 99.8 /100 | #61 | Exceptional 91.9% |
| Thais | 99.8 /100 | #62 | Exceptional 91.9% |
| Chinese | 99.8 /100 | #63 | Exceptional 91.9% |
| Croatians | 99.8 /100 | #64 | Exceptional 91.9% |
| Immigrants | Laos | 99.8 /100 | #65 | Exceptional 91.8% |
| Canadians | 99.8 /100 | #66 | Exceptional 91.8% |
| Spaniards | 99.8 /100 | #67 | Exceptional 91.8% |
| Immigrants | Scotland | 99.7 /100 | #68 | Exceptional 91.8% |
| Palestinians | 99.7 /100 | #69 | Exceptional 91.7% |