Guatemalan vs Thai 1 or more Vehicles in Household
COMPARE
Guatemalan
Thai
1 or more Vehicles in Household
1 or more Vehicles in Household Comparison
Guatemalans
Thais
89.2%
1 OR MORE VEHICLES IN HOUSEHOLD
17.8/ 100
METRIC RATING
205th/ 347
METRIC RANK
91.9%
1 OR MORE VEHICLES IN HOUSEHOLD
99.8/ 100
METRIC RATING
62nd/ 347
METRIC RANK
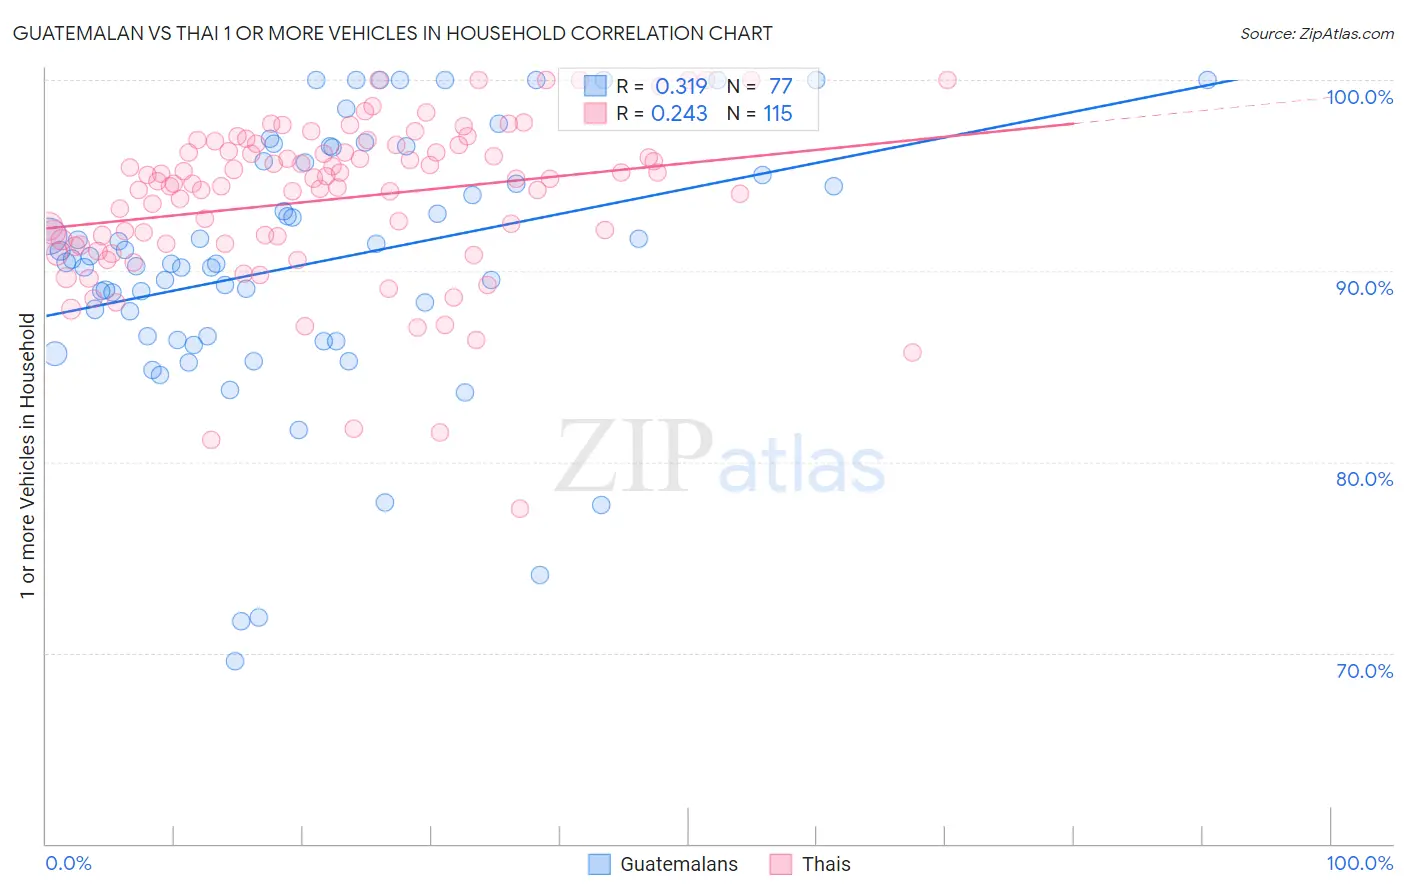
Guatemalan vs Thai 1 or more Vehicles in Household Correlation Chart
The statistical analysis conducted on geographies consisting of 409,296,484 people shows a mild positive correlation between the proportion of Guatemalans and percentage of households with 1 or more vehicles available in the United States with a correlation coefficient (R) of 0.319 and weighted average of 89.2%. Similarly, the statistical analysis conducted on geographies consisting of 456,543,846 people shows a weak positive correlation between the proportion of Thais and percentage of households with 1 or more vehicles available in the United States with a correlation coefficient (R) of 0.243 and weighted average of 91.9%, a difference of 3.0%.
1 or more Vehicles in Household Correlation Summary
| Measurement | Guatemalan | Thai |
| Minimum | 69.6% | 77.6% |
| Maximum | 100.0% | 100.0% |
| Range | 30.4% | 22.4% |
| Mean | 90.4% | 93.8% |
| Median | 90.4% | 94.7% |
| Interquartile 25% (IQ1) | 86.5% | 91.4% |
| Interquartile 75% (IQ3) | 95.7% | 96.6% |
| Interquartile Range (IQR) | 9.3% | 5.1% |
| Standard Deviation (Sample) | 6.9% | 4.2% |
| Standard Deviation (Population) | 6.8% | 4.2% |
Similar Demographics by 1 or more Vehicles in Household
Demographics Similar to Guatemalans by 1 or more Vehicles in Household
In terms of 1 or more vehicles in household, the demographic groups most similar to Guatemalans are Romanian (89.2%, a difference of 0.010%), Cambodian (89.2%, a difference of 0.030%), Iroquois (89.2%, a difference of 0.050%), Apache (89.1%, a difference of 0.050%), and Immigrants from Western Europe (89.2%, a difference of 0.070%).
| Demographics | Rating | Rank | 1 or more Vehicles in Household |
| Pennsylvania Germans | 22.9 /100 | #198 | Fair 89.3% |
| Immigrants | Asia | 22.8 /100 | #199 | Fair 89.3% |
| Central Americans | 21.4 /100 | #200 | Fair 89.2% |
| Immigrants | Western Europe | 20.5 /100 | #201 | Fair 89.2% |
| Iroquois | 19.8 /100 | #202 | Poor 89.2% |
| Cambodians | 18.9 /100 | #203 | Poor 89.2% |
| Romanians | 18.2 /100 | #204 | Poor 89.2% |
| Guatemalans | 17.8 /100 | #205 | Poor 89.2% |
| Apache | 16.2 /100 | #206 | Poor 89.1% |
| Immigrants | Denmark | 14.8 /100 | #207 | Poor 89.1% |
| Immigrants | Chile | 14.4 /100 | #208 | Poor 89.1% |
| Immigrants | Italy | 14.0 /100 | #209 | Poor 89.1% |
| Dutch West Indians | 13.5 /100 | #210 | Poor 89.0% |
| Sierra Leoneans | 13.0 /100 | #211 | Poor 89.0% |
| Somalis | 12.8 /100 | #212 | Poor 89.0% |
Demographics Similar to Thais by 1 or more Vehicles in Household
In terms of 1 or more vehicles in household, the demographic groups most similar to Thais are Immigrants from India (91.9%, a difference of 0.0%), Slovak (91.9%, a difference of 0.020%), Chinese (91.9%, a difference of 0.020%), Croatian (91.9%, a difference of 0.030%), and Venezuelan (91.9%, a difference of 0.040%).
| Demographics | Rating | Rank | 1 or more Vehicles in Household |
| Immigrants | Afghanistan | 99.9 /100 | #55 | Exceptional 92.0% |
| Immigrants | Venezuela | 99.9 /100 | #56 | Exceptional 92.0% |
| Iraqis | 99.8 /100 | #57 | Exceptional 91.9% |
| Immigrants | Mexico | 99.8 /100 | #58 | Exceptional 91.9% |
| Venezuelans | 99.8 /100 | #59 | Exceptional 91.9% |
| Slovaks | 99.8 /100 | #60 | Exceptional 91.9% |
| Immigrants | India | 99.8 /100 | #61 | Exceptional 91.9% |
| Thais | 99.8 /100 | #62 | Exceptional 91.9% |
| Chinese | 99.8 /100 | #63 | Exceptional 91.9% |
| Croatians | 99.8 /100 | #64 | Exceptional 91.9% |
| Immigrants | Laos | 99.8 /100 | #65 | Exceptional 91.8% |
| Canadians | 99.8 /100 | #66 | Exceptional 91.8% |
| Spaniards | 99.8 /100 | #67 | Exceptional 91.8% |
| Immigrants | Scotland | 99.7 /100 | #68 | Exceptional 91.8% |
| Palestinians | 99.7 /100 | #69 | Exceptional 91.7% |