Egyptian vs Immigrants from Guyana 1 or more Vehicles in Household
COMPARE
Egyptian
Immigrants from Guyana
1 or more Vehicles in Household
1 or more Vehicles in Household Comparison
Egyptians
Immigrants from Guyana
88.2%
1 OR MORE VEHICLES IN HOUSEHOLD
1.2/ 100
METRIC RATING
250th/ 347
METRIC RANK
70.6%
1 OR MORE VEHICLES IN HOUSEHOLD
0.0/ 100
METRIC RATING
342nd/ 347
METRIC RANK
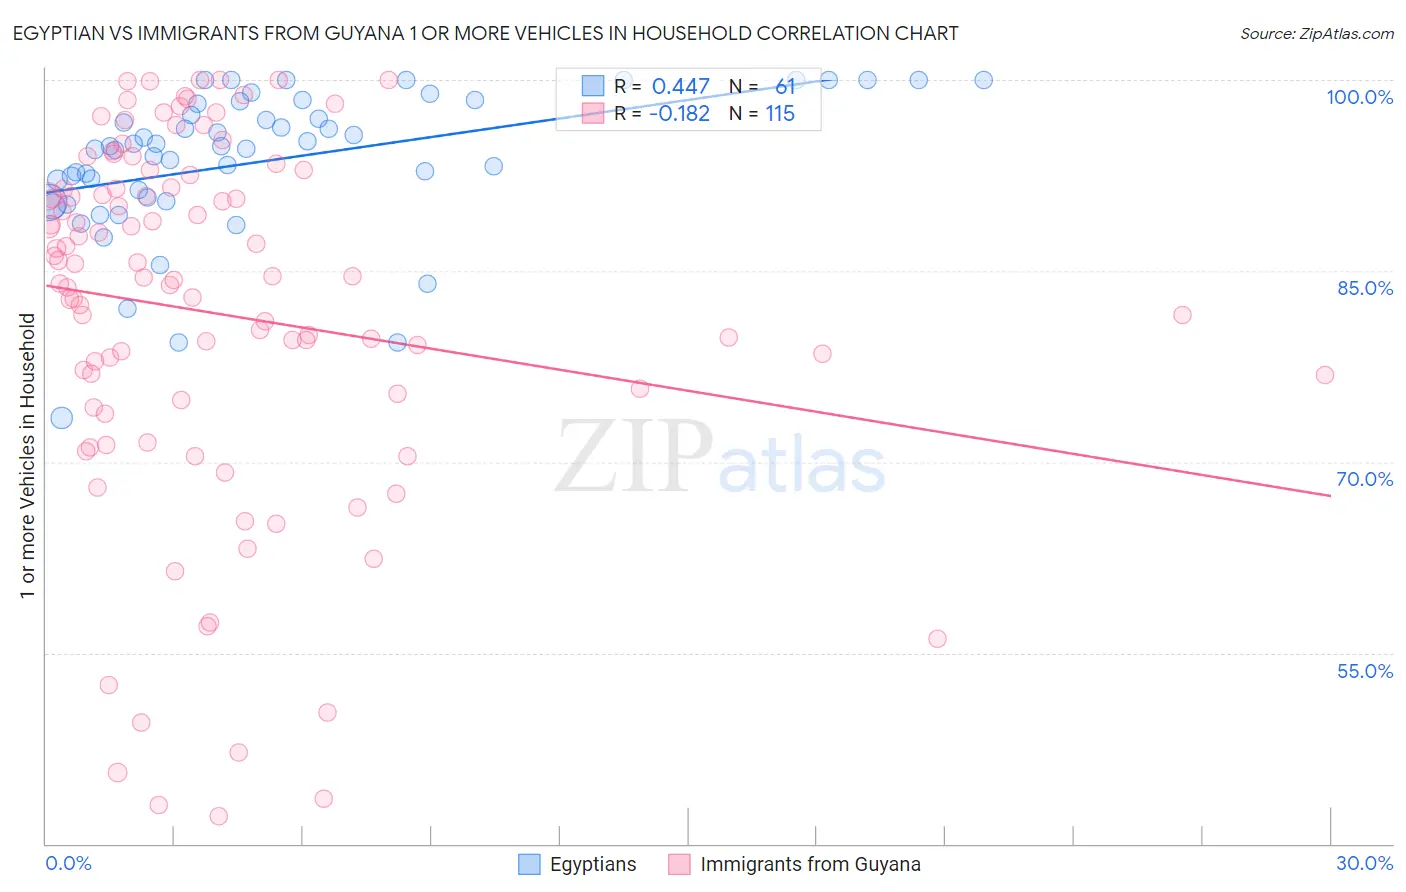
Egyptian vs Immigrants from Guyana 1 or more Vehicles in Household Correlation Chart
The statistical analysis conducted on geographies consisting of 276,665,499 people shows a moderate positive correlation between the proportion of Egyptians and percentage of households with 1 or more vehicles available in the United States with a correlation coefficient (R) of 0.447 and weighted average of 88.2%. Similarly, the statistical analysis conducted on geographies consisting of 183,508,680 people shows a poor negative correlation between the proportion of Immigrants from Guyana and percentage of households with 1 or more vehicles available in the United States with a correlation coefficient (R) of -0.182 and weighted average of 70.6%, a difference of 24.9%.
1 or more Vehicles in Household Correlation Summary
| Measurement | Egyptian | Immigrants from Guyana |
| Minimum | 73.5% | 42.2% |
| Maximum | 100.0% | 100.0% |
| Range | 26.5% | 57.8% |
| Mean | 93.7% | 81.7% |
| Median | 94.7% | 84.4% |
| Interquartile 25% (IQ1) | 90.6% | 74.9% |
| Interquartile 75% (IQ3) | 98.2% | 91.6% |
| Interquartile Range (IQR) | 7.6% | 16.7% |
| Standard Deviation (Sample) | 5.7% | 14.3% |
| Standard Deviation (Population) | 5.6% | 14.3% |
Similar Demographics by 1 or more Vehicles in Household
Demographics Similar to Egyptians by 1 or more Vehicles in Household
In terms of 1 or more vehicles in household, the demographic groups most similar to Egyptians are Immigrants from Serbia (88.2%, a difference of 0.010%), Black/African American (88.2%, a difference of 0.040%), Immigrants from Uruguay (88.1%, a difference of 0.060%), Immigrants from Nigeria (88.2%, a difference of 0.090%), and Honduran (88.1%, a difference of 0.10%).
| Demographics | Rating | Rank | 1 or more Vehicles in Household |
| Immigrants | Belgium | 2.1 /100 | #243 | Tragic 88.4% |
| Immigrants | Portugal | 2.0 /100 | #244 | Tragic 88.3% |
| Immigrants | Czechoslovakia | 1.9 /100 | #245 | Tragic 88.3% |
| Menominee | 1.9 /100 | #246 | Tragic 88.3% |
| Immigrants | Honduras | 1.7 /100 | #247 | Tragic 88.3% |
| Immigrants | Nigeria | 1.5 /100 | #248 | Tragic 88.2% |
| Blacks/African Americans | 1.4 /100 | #249 | Tragic 88.2% |
| Egyptians | 1.2 /100 | #250 | Tragic 88.2% |
| Immigrants | Serbia | 1.2 /100 | #251 | Tragic 88.2% |
| Immigrants | Uruguay | 1.1 /100 | #252 | Tragic 88.1% |
| Hondurans | 1.0 /100 | #253 | Tragic 88.1% |
| Haitians | 0.9 /100 | #254 | Tragic 88.1% |
| Immigrants | Latvia | 0.9 /100 | #255 | Tragic 88.1% |
| Colombians | 0.9 /100 | #256 | Tragic 88.0% |
| Liberians | 0.9 /100 | #257 | Tragic 88.0% |
Demographics Similar to Immigrants from Guyana by 1 or more Vehicles in Household
In terms of 1 or more vehicles in household, the demographic groups most similar to Immigrants from Guyana are Immigrants from Barbados (70.6%, a difference of 0.010%), Dominican (70.7%, a difference of 0.15%), British West Indian (70.4%, a difference of 0.31%), Guyanese (70.8%, a difference of 0.34%), and Inupiat (71.5%, a difference of 1.4%).
| Demographics | Rating | Rank | 1 or more Vehicles in Household |
| Immigrants | Ecuador | 0.0 /100 | #333 | Tragic 76.2% |
| Immigrants | Bangladesh | 0.0 /100 | #334 | Tragic 74.3% |
| Barbadians | 0.0 /100 | #335 | Tragic 74.0% |
| Vietnamese | 0.0 /100 | #336 | Tragic 73.8% |
| Immigrants | Uzbekistan | 0.0 /100 | #337 | Tragic 73.4% |
| Inupiat | 0.0 /100 | #338 | Tragic 71.5% |
| Guyanese | 0.0 /100 | #339 | Tragic 70.8% |
| Dominicans | 0.0 /100 | #340 | Tragic 70.7% |
| Immigrants | Barbados | 0.0 /100 | #341 | Tragic 70.6% |
| Immigrants | Guyana | 0.0 /100 | #342 | Tragic 70.6% |
| British West Indians | 0.0 /100 | #343 | Tragic 70.4% |
| Immigrants | Dominican Republic | 0.0 /100 | #344 | Tragic 68.6% |
| Immigrants | St. Vincent and the Grenadines | 0.0 /100 | #345 | Tragic 64.7% |
| Immigrants | Grenada | 0.0 /100 | #346 | Tragic 62.7% |
| Yup'ik | 0.0 /100 | #347 | Tragic 58.4% |