Egyptian vs Tsimshian 1 or more Vehicles in Household
COMPARE
Egyptian
Tsimshian
1 or more Vehicles in Household
1 or more Vehicles in Household Comparison
Egyptians
Tsimshian
88.2%
1 OR MORE VEHICLES IN HOUSEHOLD
1.2/ 100
METRIC RATING
250th/ 347
METRIC RANK
91.4%
1 OR MORE VEHICLES IN HOUSEHOLD
99.3/ 100
METRIC RATING
85th/ 347
METRIC RANK
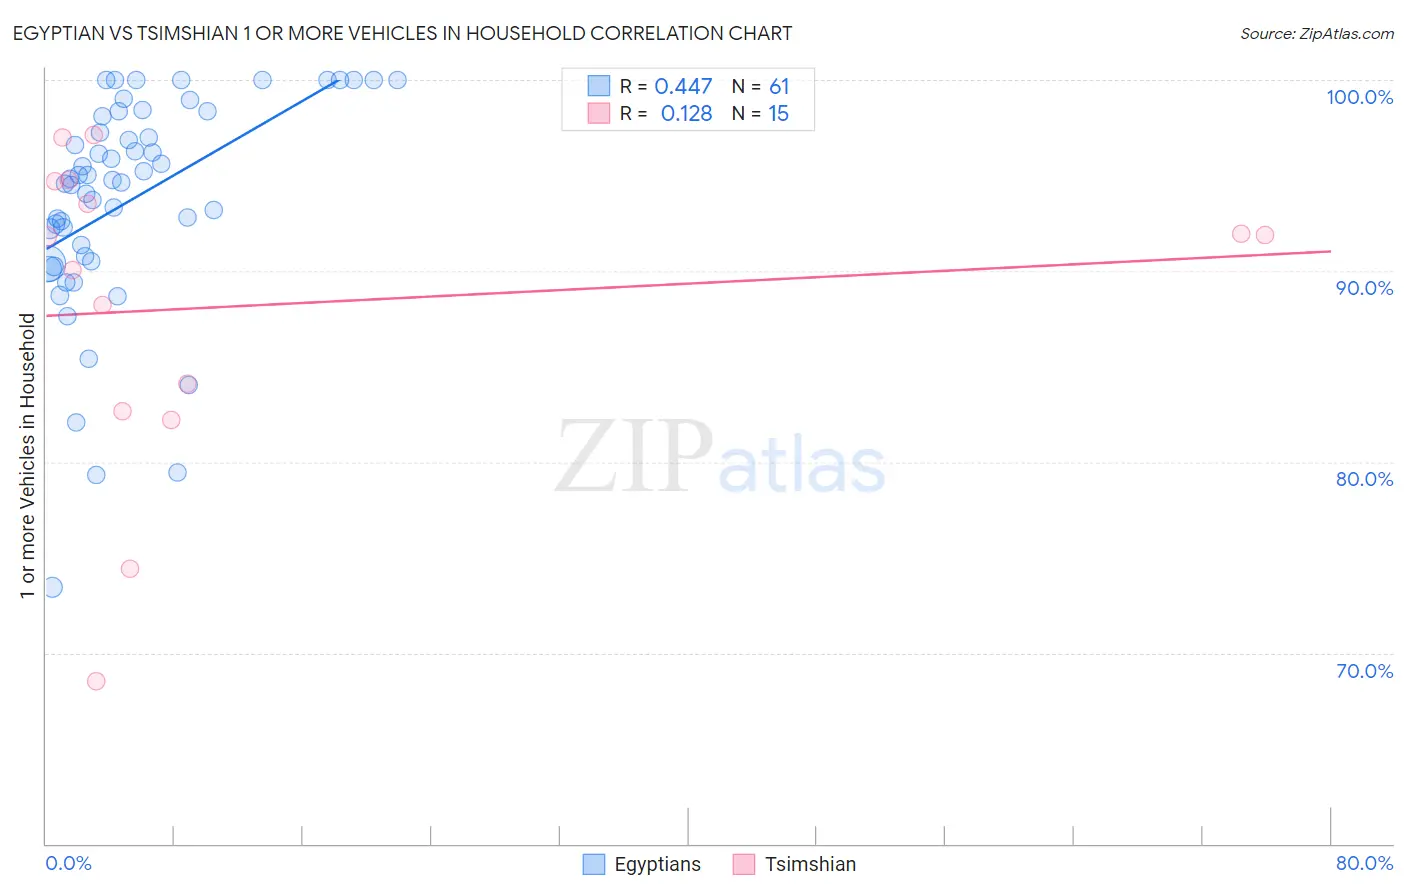
Egyptian vs Tsimshian 1 or more Vehicles in Household Correlation Chart
The statistical analysis conducted on geographies consisting of 276,665,499 people shows a moderate positive correlation between the proportion of Egyptians and percentage of households with 1 or more vehicles available in the United States with a correlation coefficient (R) of 0.447 and weighted average of 88.2%. Similarly, the statistical analysis conducted on geographies consisting of 15,626,544 people shows a poor positive correlation between the proportion of Tsimshian and percentage of households with 1 or more vehicles available in the United States with a correlation coefficient (R) of 0.128 and weighted average of 91.4%, a difference of 3.7%.
1 or more Vehicles in Household Correlation Summary
| Measurement | Egyptian | Tsimshian |
| Minimum | 73.5% | 68.5% |
| Maximum | 100.0% | 97.2% |
| Range | 26.5% | 28.6% |
| Mean | 93.7% | 88.2% |
| Median | 94.7% | 91.8% |
| Interquartile 25% (IQ1) | 90.6% | 82.7% |
| Interquartile 75% (IQ3) | 98.2% | 94.7% |
| Interquartile Range (IQR) | 7.6% | 12.0% |
| Standard Deviation (Sample) | 5.7% | 8.4% |
| Standard Deviation (Population) | 5.6% | 8.1% |
Similar Demographics by 1 or more Vehicles in Household
Demographics Similar to Egyptians by 1 or more Vehicles in Household
In terms of 1 or more vehicles in household, the demographic groups most similar to Egyptians are Immigrants from Serbia (88.2%, a difference of 0.010%), Black/African American (88.2%, a difference of 0.040%), Immigrants from Uruguay (88.1%, a difference of 0.060%), Immigrants from Nigeria (88.2%, a difference of 0.090%), and Honduran (88.1%, a difference of 0.10%).
| Demographics | Rating | Rank | 1 or more Vehicles in Household |
| Immigrants | Belgium | 2.1 /100 | #243 | Tragic 88.4% |
| Immigrants | Portugal | 2.0 /100 | #244 | Tragic 88.3% |
| Immigrants | Czechoslovakia | 1.9 /100 | #245 | Tragic 88.3% |
| Menominee | 1.9 /100 | #246 | Tragic 88.3% |
| Immigrants | Honduras | 1.7 /100 | #247 | Tragic 88.3% |
| Immigrants | Nigeria | 1.5 /100 | #248 | Tragic 88.2% |
| Blacks/African Americans | 1.4 /100 | #249 | Tragic 88.2% |
| Egyptians | 1.2 /100 | #250 | Tragic 88.2% |
| Immigrants | Serbia | 1.2 /100 | #251 | Tragic 88.2% |
| Immigrants | Uruguay | 1.1 /100 | #252 | Tragic 88.1% |
| Hondurans | 1.0 /100 | #253 | Tragic 88.1% |
| Haitians | 0.9 /100 | #254 | Tragic 88.1% |
| Immigrants | Latvia | 0.9 /100 | #255 | Tragic 88.1% |
| Colombians | 0.9 /100 | #256 | Tragic 88.0% |
| Liberians | 0.9 /100 | #257 | Tragic 88.0% |
Demographics Similar to Tsimshian by 1 or more Vehicles in Household
In terms of 1 or more vehicles in household, the demographic groups most similar to Tsimshian are Jordanian (91.4%, a difference of 0.010%), Lebanese (91.4%, a difference of 0.020%), Immigrants from England (91.4%, a difference of 0.020%), Osage (91.4%, a difference of 0.020%), and Immigrants from South Eastern Asia (91.4%, a difference of 0.030%).
| Demographics | Rating | Rank | 1 or more Vehicles in Household |
| Iranians | 99.4 /100 | #78 | Exceptional 91.5% |
| Immigrants | South Central Asia | 99.4 /100 | #79 | Exceptional 91.5% |
| Bolivians | 99.4 /100 | #80 | Exceptional 91.5% |
| Immigrants | South Eastern Asia | 99.3 /100 | #81 | Exceptional 91.4% |
| Lebanese | 99.3 /100 | #82 | Exceptional 91.4% |
| Immigrants | England | 99.3 /100 | #83 | Exceptional 91.4% |
| Jordanians | 99.3 /100 | #84 | Exceptional 91.4% |
| Tsimshian | 99.3 /100 | #85 | Exceptional 91.4% |
| Osage | 99.2 /100 | #86 | Exceptional 91.4% |
| Immigrants | Germany | 99.2 /100 | #87 | Exceptional 91.4% |
| Spanish Americans | 99.2 /100 | #88 | Exceptional 91.4% |
| Bangladeshis | 99.2 /100 | #89 | Exceptional 91.4% |
| Immigrants | Canada | 99.2 /100 | #90 | Exceptional 91.4% |
| Immigrants | Jordan | 99.2 /100 | #91 | Exceptional 91.4% |
| Bhutanese | 99.2 /100 | #92 | Exceptional 91.4% |