Ecuadorian vs Immigrants from Eastern Europe Births to Unmarried Women
COMPARE
Ecuadorian
Immigrants from Eastern Europe
Births to Unmarried Women
Births to Unmarried Women Comparison
Ecuadorians
Immigrants from Eastern Europe
33.3%
BIRTHS TO UNMARRIED WOMEN
10.5/ 100
METRIC RATING
211th/ 347
METRIC RANK
27.6%
BIRTHS TO UNMARRIED WOMEN
99.6/ 100
METRIC RATING
42nd/ 347
METRIC RANK
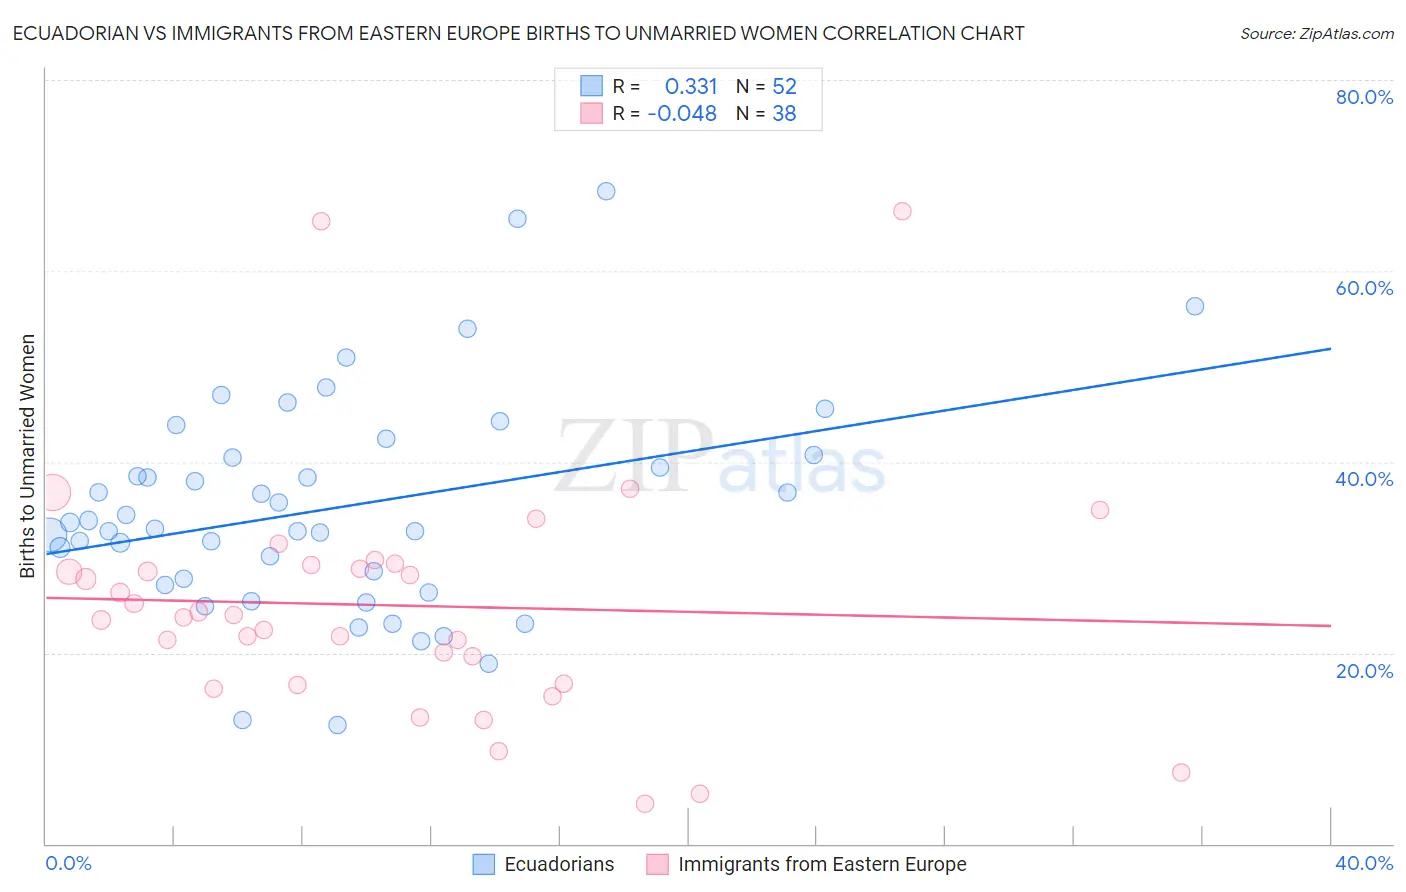
Ecuadorian vs Immigrants from Eastern Europe Births to Unmarried Women Correlation Chart
The statistical analysis conducted on geographies consisting of 300,726,329 people shows a mild positive correlation between the proportion of Ecuadorians and percentage of births to unmarried women in the United States with a correlation coefficient (R) of 0.331 and weighted average of 33.3%. Similarly, the statistical analysis conducted on geographies consisting of 434,188,066 people shows no correlation between the proportion of Immigrants from Eastern Europe and percentage of births to unmarried women in the United States with a correlation coefficient (R) of -0.048 and weighted average of 27.6%, a difference of 20.7%.
Births to Unmarried Women Correlation Summary
| Measurement | Ecuadorian | Immigrants from Eastern Europe |
| Minimum | 12.5% | 4.2% |
| Maximum | 68.3% | 66.3% |
| Range | 55.8% | 62.1% |
| Mean | 35.1% | 25.0% |
| Median | 33.3% | 23.8% |
| Interquartile 25% (IQ1) | 27.4% | 16.7% |
| Interquartile 75% (IQ3) | 40.6% | 29.2% |
| Interquartile Range (IQR) | 13.2% | 12.5% |
| Standard Deviation (Sample) | 11.5% | 12.8% |
| Standard Deviation (Population) | 11.3% | 12.6% |
Similar Demographics by Births to Unmarried Women
Demographics Similar to Ecuadorians by Births to Unmarried Women
In terms of births to unmarried women, the demographic groups most similar to Ecuadorians are White/Caucasian (33.3%, a difference of 0.050%), Scotch-Irish (33.3%, a difference of 0.050%), Celtic (33.3%, a difference of 0.070%), Hawaiian (33.2%, a difference of 0.19%), and Immigrants from Sudan (33.2%, a difference of 0.22%).
| Demographics | Rating | Rank | Births to Unmarried Women |
| Immigrants | Africa | 14.3 /100 | #204 | Poor 33.0% |
| German Russians | 13.1 /100 | #205 | Poor 33.1% |
| Uruguayans | 12.8 /100 | #206 | Poor 33.1% |
| Immigrants | Sudan | 11.5 /100 | #207 | Poor 33.2% |
| Hawaiians | 11.3 /100 | #208 | Poor 33.2% |
| Whites/Caucasians | 10.7 /100 | #209 | Poor 33.3% |
| Scotch-Irish | 10.7 /100 | #210 | Poor 33.3% |
| Ecuadorians | 10.5 /100 | #211 | Poor 33.3% |
| Celtics | 10.2 /100 | #212 | Poor 33.3% |
| Immigrants | Costa Rica | 9.5 /100 | #213 | Tragic 33.4% |
| Slovaks | 9.3 /100 | #214 | Tragic 33.4% |
| French | 8.7 /100 | #215 | Tragic 33.4% |
| Nepalese | 7.8 /100 | #216 | Tragic 33.5% |
| Spaniards | 7.0 /100 | #217 | Tragic 33.6% |
| Immigrants | Ecuador | 5.9 /100 | #218 | Tragic 33.7% |
Demographics Similar to Immigrants from Eastern Europe by Births to Unmarried Women
In terms of births to unmarried women, the demographic groups most similar to Immigrants from Eastern Europe are Iraqi (27.6%, a difference of 0.020%), Immigrants from Bulgaria (27.6%, a difference of 0.23%), Turkish (27.4%, a difference of 0.43%), Immigrants from Indonesia (27.7%, a difference of 0.49%), and Latvian (27.7%, a difference of 0.58%).
| Demographics | Rating | Rank | Births to Unmarried Women |
| Immigrants | Ireland | 99.7 /100 | #35 | Exceptional 27.2% |
| Immigrants | Western Asia | 99.7 /100 | #36 | Exceptional 27.2% |
| Immigrants | Ukraine | 99.7 /100 | #37 | Exceptional 27.2% |
| Immigrants | Moldova | 99.7 /100 | #38 | Exceptional 27.3% |
| Immigrants | Malaysia | 99.7 /100 | #39 | Exceptional 27.4% |
| Turks | 99.6 /100 | #40 | Exceptional 27.4% |
| Iraqis | 99.6 /100 | #41 | Exceptional 27.6% |
| Immigrants | Eastern Europe | 99.6 /100 | #42 | Exceptional 27.6% |
| Immigrants | Bulgaria | 99.6 /100 | #43 | Exceptional 27.6% |
| Immigrants | Indonesia | 99.5 /100 | #44 | Exceptional 27.7% |
| Latvians | 99.5 /100 | #45 | Exceptional 27.7% |
| Immigrants | Lithuania | 99.5 /100 | #46 | Exceptional 27.7% |
| Hmong | 99.5 /100 | #47 | Exceptional 27.7% |
| Eastern Europeans | 99.5 /100 | #48 | Exceptional 27.7% |
| Immigrants | Greece | 99.4 /100 | #49 | Exceptional 27.8% |