Polish vs Osage No Vehicles in Household
COMPARE
Polish
Osage
No Vehicles in Household
No Vehicles in Household Comparison
Poles
Osage
8.4%
NO VEHICLES IN HOUSEHOLD
99.6/ 100
METRIC RATING
73rd/ 347
METRIC RANK
8.7%
NO VEHICLES IN HOUSEHOLD
99.2/ 100
METRIC RATING
88th/ 347
METRIC RANK
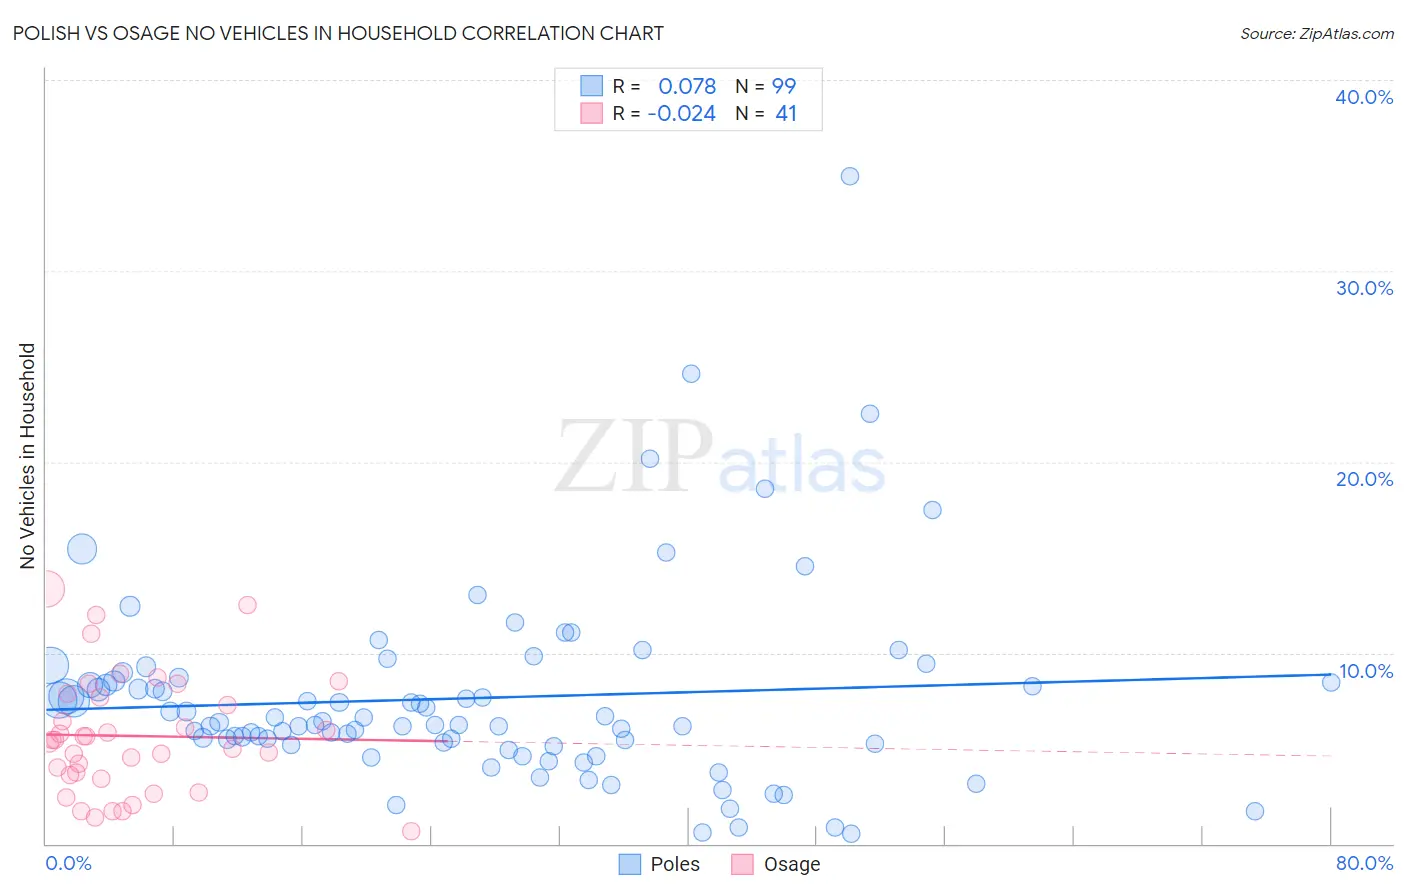
Polish vs Osage No Vehicles in Household Correlation Chart
The statistical analysis conducted on geographies consisting of 555,400,436 people shows a slight positive correlation between the proportion of Poles and percentage of households with no vehicle available in the United States with a correlation coefficient (R) of 0.078 and weighted average of 8.4%. Similarly, the statistical analysis conducted on geographies consisting of 91,756,472 people shows no correlation between the proportion of Osage and percentage of households with no vehicle available in the United States with a correlation coefficient (R) of -0.024 and weighted average of 8.7%, a difference of 3.0%.
No Vehicles in Household Correlation Summary
| Measurement | Polish | Osage |
| Minimum | 0.52% | 0.66% |
| Maximum | 35.0% | 13.3% |
| Range | 34.5% | 12.7% |
| Mean | 7.6% | 5.6% |
| Median | 6.4% | 5.4% |
| Interquartile 25% (IQ1) | 5.3% | 3.5% |
| Interquartile 75% (IQ3) | 8.5% | 7.7% |
| Interquartile Range (IQR) | 3.3% | 4.2% |
| Standard Deviation (Sample) | 5.1% | 3.1% |
| Standard Deviation (Population) | 5.1% | 3.1% |
Demographics Similar to Poles and Osage by No Vehicles in Household
In terms of no vehicles in household, the demographic groups most similar to Poles are Lithuanian (8.4%, a difference of 0.030%), Immigrants from Lebanon (8.4%, a difference of 0.060%), Cajun (8.4%, a difference of 0.090%), Cuban (8.5%, a difference of 0.86%), and Jordanian (8.5%, a difference of 1.1%). Similarly, the demographic groups most similar to Osage are Immigrants from England (8.7%, a difference of 0.12%), Immigrants from Cuba (8.7%, a difference of 0.14%), Bhutanese (8.7%, a difference of 0.23%), Bangladeshi (8.7%, a difference of 0.34%), and Lebanese (8.7%, a difference of 0.45%).
| Demographics | Rating | Rank | No Vehicles in Household |
| Cajuns | 99.6 /100 | #70 | Exceptional 8.4% |
| Immigrants | Lebanon | 99.6 /100 | #71 | Exceptional 8.4% |
| Lithuanians | 99.6 /100 | #72 | Exceptional 8.4% |
| Poles | 99.6 /100 | #73 | Exceptional 8.4% |
| Cubans | 99.5 /100 | #74 | Exceptional 8.5% |
| Jordanians | 99.5 /100 | #75 | Exceptional 8.5% |
| Immigrants | Philippines | 99.5 /100 | #76 | Exceptional 8.5% |
| Iranians | 99.5 /100 | #77 | Exceptional 8.6% |
| Immigrants | South Central Asia | 99.5 /100 | #78 | Exceptional 8.6% |
| Portuguese | 99.5 /100 | #79 | Exceptional 8.6% |
| Bolivians | 99.4 /100 | #80 | Exceptional 8.6% |
| Tsimshian | 99.4 /100 | #81 | Exceptional 8.6% |
| Immigrants | South Eastern Asia | 99.4 /100 | #82 | Exceptional 8.6% |
| Italians | 99.4 /100 | #83 | Exceptional 8.6% |
| Immigrants | Jordan | 99.3 /100 | #84 | Exceptional 8.7% |
| Lebanese | 99.3 /100 | #85 | Exceptional 8.7% |
| Bangladeshis | 99.3 /100 | #86 | Exceptional 8.7% |
| Immigrants | England | 99.2 /100 | #87 | Exceptional 8.7% |
| Osage | 99.2 /100 | #88 | Exceptional 8.7% |
| Immigrants | Cuba | 99.2 /100 | #89 | Exceptional 8.7% |
| Bhutanese | 99.2 /100 | #90 | Exceptional 8.7% |