Dominican vs Immigrants from Scotland 8th Grade
COMPARE
Dominican
Immigrants from Scotland
8th Grade
8th Grade Comparison
Dominicans
Immigrants from Scotland
92.8%
8TH GRADE
0.0/ 100
METRIC RATING
325th/ 347
METRIC RANK
96.8%
8TH GRADE
99.9/ 100
METRIC RATING
50th/ 347
METRIC RANK
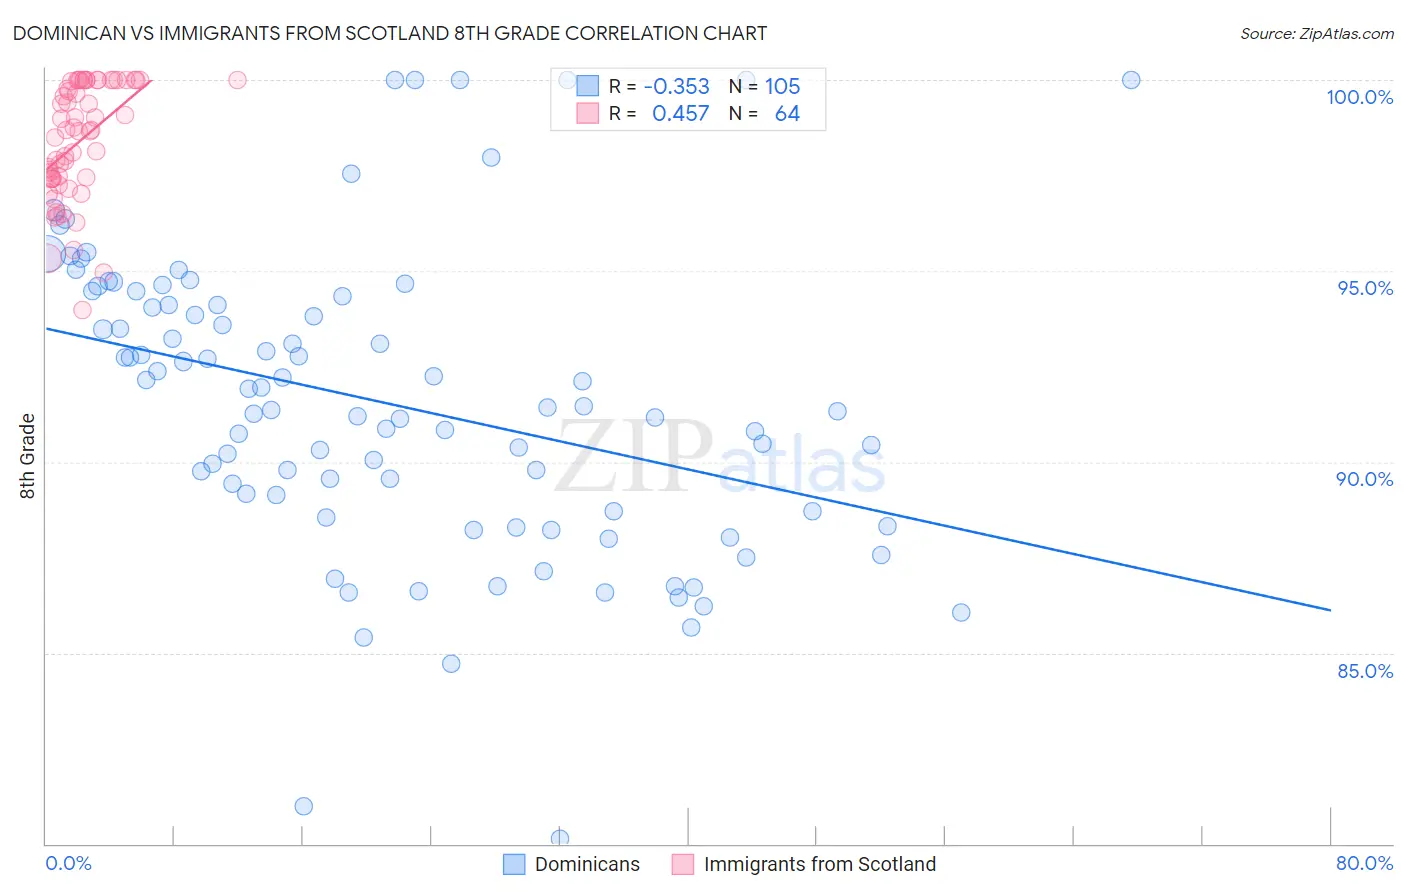
Dominican vs Immigrants from Scotland 8th Grade Correlation Chart
The statistical analysis conducted on geographies consisting of 355,142,603 people shows a mild negative correlation between the proportion of Dominicans and percentage of population with at least 8th grade education in the United States with a correlation coefficient (R) of -0.353 and weighted average of 92.8%. Similarly, the statistical analysis conducted on geographies consisting of 196,398,887 people shows a moderate positive correlation between the proportion of Immigrants from Scotland and percentage of population with at least 8th grade education in the United States with a correlation coefficient (R) of 0.457 and weighted average of 96.8%, a difference of 4.4%.
8th Grade Correlation Summary
| Measurement | Dominican | Immigrants from Scotland |
| Minimum | 80.1% | 94.0% |
| Maximum | 100.0% | 100.0% |
| Range | 19.9% | 6.0% |
| Mean | 91.6% | 98.4% |
| Median | 91.4% | 98.7% |
| Interquartile 25% (IQ1) | 88.7% | 97.4% |
| Interquartile 75% (IQ3) | 94.2% | 100.0% |
| Interquartile Range (IQR) | 5.5% | 2.6% |
| Standard Deviation (Sample) | 3.9% | 1.5% |
| Standard Deviation (Population) | 3.9% | 1.5% |
Similar Demographics by 8th Grade
Demographics Similar to Dominicans by 8th Grade
In terms of 8th grade, the demographic groups most similar to Dominicans are Central American Indian (92.7%, a difference of 0.050%), Nepalese (92.8%, a difference of 0.090%), Immigrants from Belize (92.9%, a difference of 0.16%), Nicaraguan (93.0%, a difference of 0.22%), and Immigrants from the Azores (92.5%, a difference of 0.30%).
| Demographics | Rating | Rank | 8th Grade |
| Puerto Ricans | 0.0 /100 | #318 | Tragic 93.2% |
| Immigrants | Cuba | 0.0 /100 | #319 | Tragic 93.2% |
| Immigrants | Fiji | 0.0 /100 | #320 | Tragic 93.2% |
| Belizeans | 0.0 /100 | #321 | Tragic 93.1% |
| Nicaraguans | 0.0 /100 | #322 | Tragic 93.0% |
| Immigrants | Belize | 0.0 /100 | #323 | Tragic 92.9% |
| Nepalese | 0.0 /100 | #324 | Tragic 92.8% |
| Dominicans | 0.0 /100 | #325 | Tragic 92.8% |
| Central American Indians | 0.0 /100 | #326 | Tragic 92.7% |
| Immigrants | Azores | 0.0 /100 | #327 | Tragic 92.5% |
| Immigrants | Nicaragua | 0.0 /100 | #328 | Tragic 92.5% |
| Immigrants | Cabo Verde | 0.0 /100 | #329 | Tragic 92.4% |
| Immigrants | Armenia | 0.0 /100 | #330 | Tragic 92.3% |
| Hondurans | 0.0 /100 | #331 | Tragic 92.3% |
| Immigrants | Dominican Republic | 0.0 /100 | #332 | Tragic 92.3% |
Demographics Similar to Immigrants from Scotland by 8th Grade
In terms of 8th grade, the demographic groups most similar to Immigrants from Scotland are Estonian (96.8%, a difference of 0.010%), Celtic (96.8%, a difference of 0.010%), Slavic (96.8%, a difference of 0.020%), Greek (96.8%, a difference of 0.040%), and Bulgarian (96.9%, a difference of 0.050%).
| Demographics | Rating | Rank | 8th Grade |
| Aleuts | 99.9 /100 | #43 | Exceptional 96.9% |
| Maltese | 99.9 /100 | #44 | Exceptional 96.9% |
| Northern Europeans | 99.9 /100 | #45 | Exceptional 96.9% |
| Czechoslovakians | 99.9 /100 | #46 | Exceptional 96.9% |
| Bulgarians | 99.9 /100 | #47 | Exceptional 96.9% |
| Slavs | 99.9 /100 | #48 | Exceptional 96.8% |
| Estonians | 99.9 /100 | #49 | Exceptional 96.8% |
| Immigrants | Scotland | 99.9 /100 | #50 | Exceptional 96.8% |
| Celtics | 99.9 /100 | #51 | Exceptional 96.8% |
| Greeks | 99.9 /100 | #52 | Exceptional 96.8% |
| Austrians | 99.9 /100 | #53 | Exceptional 96.7% |
| Serbians | 99.8 /100 | #54 | Exceptional 96.7% |
| Russians | 99.8 /100 | #55 | Exceptional 96.7% |
| Australians | 99.8 /100 | #56 | Exceptional 96.7% |
| Macedonians | 99.8 /100 | #57 | Exceptional 96.7% |