Danish vs Pima Seniors Poverty Over the Age of 75
COMPARE
Danish
Pima
Seniors Poverty Over the Age of 75
Seniors Poverty Over the Age of 75 Comparison
Danes
Pima
10.2%
SENIORS POVERTY OVER THE AGE OF 75
100.0/ 100
METRIC RATING
6th/ 347
METRIC RANK
23.9%
SENIORS POVERTY OVER THE AGE OF 75
0.0/ 100
METRIC RATING
347th/ 347
METRIC RANK
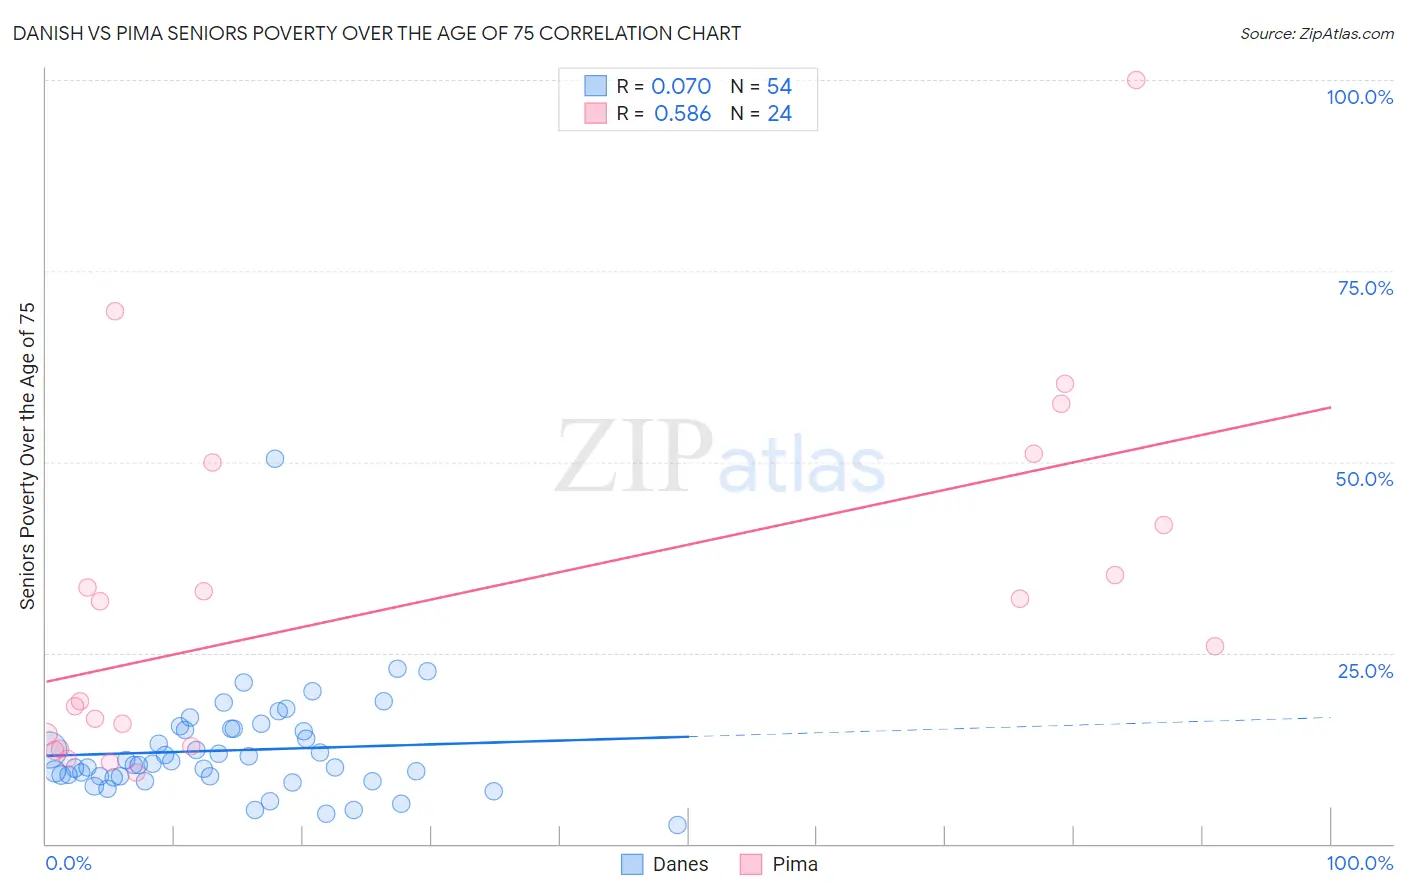
Danish vs Pima Seniors Poverty Over the Age of 75 Correlation Chart
The statistical analysis conducted on geographies consisting of 465,098,722 people shows a slight positive correlation between the proportion of Danes and poverty level among seniors over the age of 75 in the United States with a correlation coefficient (R) of 0.070 and weighted average of 10.2%. Similarly, the statistical analysis conducted on geographies consisting of 61,445,536 people shows a substantial positive correlation between the proportion of Pima and poverty level among seniors over the age of 75 in the United States with a correlation coefficient (R) of 0.586 and weighted average of 23.9%, a difference of 133.5%.
Seniors Poverty Over the Age of 75 Correlation Summary
| Measurement | Danish | Pima |
| Minimum | 2.5% | 9.4% |
| Maximum | 50.3% | 100.0% |
| Range | 47.8% | 90.6% |
| Mean | 12.2% | 32.2% |
| Median | 10.4% | 28.8% |
| Interquartile 25% (IQ1) | 8.8% | 13.6% |
| Interquartile 75% (IQ3) | 15.1% | 45.8% |
| Interquartile Range (IQR) | 6.3% | 32.3% |
| Standard Deviation (Sample) | 7.1% | 22.9% |
| Standard Deviation (Population) | 7.0% | 22.4% |
Similar Demographics by Seniors Poverty Over the Age of 75
Demographics Similar to Danes by Seniors Poverty Over the Age of 75
In terms of seniors poverty over the age of 75, the demographic groups most similar to Danes are Norwegian (10.2%, a difference of 0.27%), Maltese (10.3%, a difference of 0.65%), Swedish (10.2%, a difference of 0.67%), German (10.4%, a difference of 1.2%), and Native Hawaiian (10.1%, a difference of 1.5%).
| Demographics | Rating | Rank | Seniors Poverty Over the Age of 75 |
| Chinese | 100.0 /100 | #1 | Exceptional 9.1% |
| Tlingit-Haida | 100.0 /100 | #2 | Exceptional 9.7% |
| Native Hawaiians | 100.0 /100 | #3 | Exceptional 10.1% |
| Swedes | 100.0 /100 | #4 | Exceptional 10.2% |
| Norwegians | 100.0 /100 | #5 | Exceptional 10.2% |
| Danes | 100.0 /100 | #6 | Exceptional 10.2% |
| Maltese | 100.0 /100 | #7 | Exceptional 10.3% |
| Germans | 99.9 /100 | #8 | Exceptional 10.4% |
| English | 99.9 /100 | #9 | Exceptional 10.4% |
| Scandinavians | 99.9 /100 | #10 | Exceptional 10.4% |
| Immigrants | India | 99.9 /100 | #11 | Exceptional 10.4% |
| Tongans | 99.9 /100 | #12 | Exceptional 10.5% |
| Croatians | 99.9 /100 | #13 | Exceptional 10.5% |
| Scottish | 99.9 /100 | #14 | Exceptional 10.5% |
| Europeans | 99.9 /100 | #15 | Exceptional 10.5% |
Demographics Similar to Pima by Seniors Poverty Over the Age of 75
In terms of seniors poverty over the age of 75, the demographic groups most similar to Pima are Puerto Rican (23.2%, a difference of 2.9%), Immigrants from Dominican Republic (20.1%, a difference of 19.1%), Immigrants from Cuba (19.9%, a difference of 20.0%), Lumbee (19.7%, a difference of 20.9%), and Dominican (19.6%, a difference of 21.7%).
| Demographics | Rating | Rank | Seniors Poverty Over the Age of 75 |
| Immigrants | Nicaragua | 0.0 /100 | #333 | Tragic 17.6% |
| Immigrants | Grenada | 0.0 /100 | #334 | Tragic 17.8% |
| Cubans | 0.0 /100 | #335 | Tragic 18.0% |
| Immigrants | Caribbean | 0.0 /100 | #336 | Tragic 18.2% |
| Yakama | 0.0 /100 | #337 | Tragic 18.3% |
| Immigrants | Cabo Verde | 0.0 /100 | #338 | Tragic 18.5% |
| Hopi | 0.0 /100 | #339 | Tragic 18.9% |
| Tohono O'odham | 0.0 /100 | #340 | Tragic 19.1% |
| Navajo | 0.0 /100 | #341 | Tragic 19.4% |
| Dominicans | 0.0 /100 | #342 | Tragic 19.6% |
| Lumbee | 0.0 /100 | #343 | Tragic 19.7% |
| Immigrants | Cuba | 0.0 /100 | #344 | Tragic 19.9% |
| Immigrants | Dominican Republic | 0.0 /100 | #345 | Tragic 20.1% |
| Puerto Ricans | 0.0 /100 | #346 | Tragic 23.2% |
| Pima | 0.0 /100 | #347 | Tragic 23.9% |