Danish vs Marshallese 1 or more Vehicles in Household
COMPARE
Danish
Marshallese
1 or more Vehicles in Household
1 or more Vehicles in Household Comparison
Danes
Marshallese
93.5%
1 OR MORE VEHICLES IN HOUSEHOLD
100.0/ 100
METRIC RATING
6th/ 347
METRIC RANK
90.4%
1 OR MORE VEHICLES IN HOUSEHOLD
88.9/ 100
METRIC RATING
129th/ 347
METRIC RANK
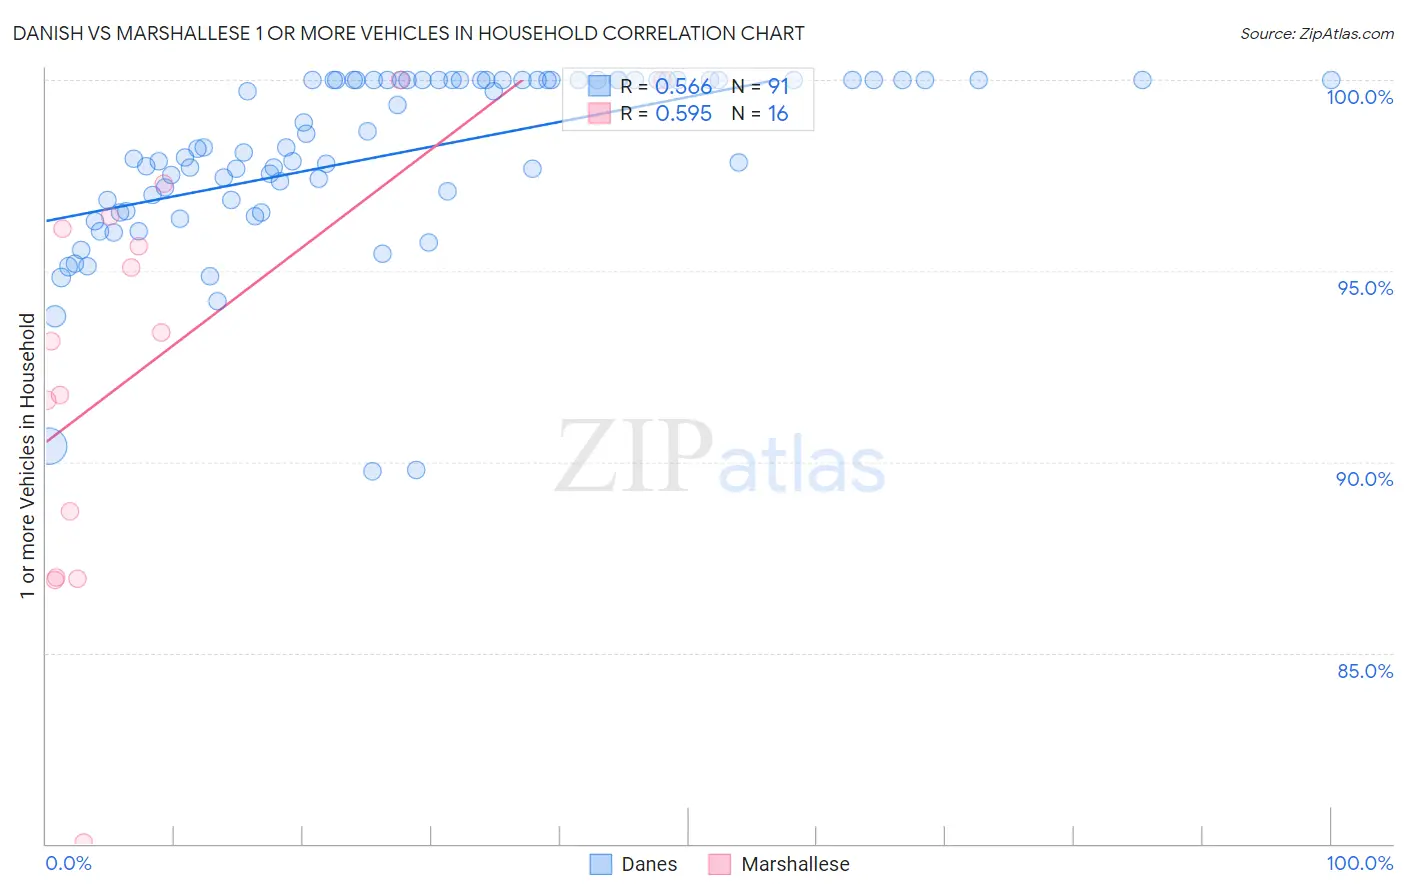
Danish vs Marshallese 1 or more Vehicles in Household Correlation Chart
The statistical analysis conducted on geographies consisting of 473,956,098 people shows a substantial positive correlation between the proportion of Danes and percentage of households with 1 or more vehicles available in the United States with a correlation coefficient (R) of 0.566 and weighted average of 93.5%. Similarly, the statistical analysis conducted on geographies consisting of 14,761,315 people shows a substantial positive correlation between the proportion of Marshallese and percentage of households with 1 or more vehicles available in the United States with a correlation coefficient (R) of 0.595 and weighted average of 90.4%, a difference of 3.5%.
1 or more Vehicles in Household Correlation Summary
| Measurement | Danish | Marshallese |
| Minimum | 89.7% | 80.0% |
| Maximum | 100.0% | 100.0% |
| Range | 10.3% | 20.0% |
| Mean | 98.0% | 92.5% |
| Median | 98.2% | 93.3% |
| Interquartile 25% (IQ1) | 96.9% | 87.8% |
| Interquartile 75% (IQ3) | 100.0% | 96.3% |
| Interquartile Range (IQR) | 3.1% | 8.4% |
| Standard Deviation (Sample) | 2.3% | 5.5% |
| Standard Deviation (Population) | 2.3% | 5.3% |
Similar Demographics by 1 or more Vehicles in Household
Demographics Similar to Danes by 1 or more Vehicles in Household
In terms of 1 or more vehicles in household, the demographic groups most similar to Danes are Yakama (93.6%, a difference of 0.020%), German (93.6%, a difference of 0.12%), Norwegian (93.7%, a difference of 0.16%), Scottish (93.4%, a difference of 0.19%), and Swedish (93.3%, a difference of 0.23%).
| Demographics | Rating | Rank | 1 or more Vehicles in Household |
| Luxembourgers | 100.0 /100 | #1 | Exceptional 94.8% |
| English | 100.0 /100 | #2 | Exceptional 93.8% |
| Norwegians | 100.0 /100 | #3 | Exceptional 93.7% |
| Germans | 100.0 /100 | #4 | Exceptional 93.6% |
| Yakama | 100.0 /100 | #5 | Exceptional 93.6% |
| Danes | 100.0 /100 | #6 | Exceptional 93.5% |
| Scottish | 100.0 /100 | #7 | Exceptional 93.4% |
| Swedes | 100.0 /100 | #8 | Exceptional 93.3% |
| Scotch-Irish | 100.0 /100 | #9 | Exceptional 93.3% |
| Dutch | 100.0 /100 | #10 | Exceptional 93.3% |
| Czechs | 100.0 /100 | #11 | Exceptional 93.3% |
| Scandinavians | 100.0 /100 | #12 | Exceptional 93.1% |
| Whites/Caucasians | 100.0 /100 | #13 | Exceptional 93.1% |
| Irish | 100.0 /100 | #14 | Exceptional 93.1% |
| Mexicans | 100.0 /100 | #15 | Exceptional 93.0% |
Demographics Similar to Marshallese by 1 or more Vehicles in Household
In terms of 1 or more vehicles in household, the demographic groups most similar to Marshallese are Nicaraguan (90.4%, a difference of 0.0%), Immigrants from the Azores (90.4%, a difference of 0.010%), Burmese (90.4%, a difference of 0.010%), Immigrants from Cameroon (90.4%, a difference of 0.020%), and Immigrants from Kenya (90.4%, a difference of 0.020%).
| Demographics | Rating | Rank | 1 or more Vehicles in Household |
| Costa Ricans | 92.0 /100 | #122 | Exceptional 90.5% |
| Fijians | 91.8 /100 | #123 | Exceptional 90.5% |
| Puget Sound Salish | 91.5 /100 | #124 | Exceptional 90.5% |
| Immigrants | Korea | 90.5 /100 | #125 | Exceptional 90.5% |
| Immigrants | Cameroon | 89.4 /100 | #126 | Excellent 90.4% |
| Immigrants | Azores | 89.1 /100 | #127 | Excellent 90.4% |
| Burmese | 89.0 /100 | #128 | Excellent 90.4% |
| Marshallese | 88.9 /100 | #129 | Excellent 90.4% |
| Nicaraguans | 88.8 /100 | #130 | Excellent 90.4% |
| Immigrants | Kenya | 88.5 /100 | #131 | Excellent 90.4% |
| Immigrants | South Africa | 88.1 /100 | #132 | Excellent 90.4% |
| Immigrants | Syria | 87.5 /100 | #133 | Excellent 90.4% |
| Kenyans | 87.0 /100 | #134 | Excellent 90.4% |
| Immigrants | Oceania | 86.9 /100 | #135 | Excellent 90.4% |
| Hungarians | 86.5 /100 | #136 | Excellent 90.3% |