Czech vs Comanche 2 or more Vehicles in Household
COMPARE
Czech
Comanche
2 or more Vehicles in Household
2 or more Vehicles in Household Comparison
Czechs
Comanche
61.5%
2 OR MORE VEHICLES IN HOUSEHOLD
100.0/ 100
METRIC RATING
14th/ 347
METRIC RANK
56.5%
2 OR MORE VEHICLES IN HOUSEHOLD
88.4/ 100
METRIC RATING
133rd/ 347
METRIC RANK
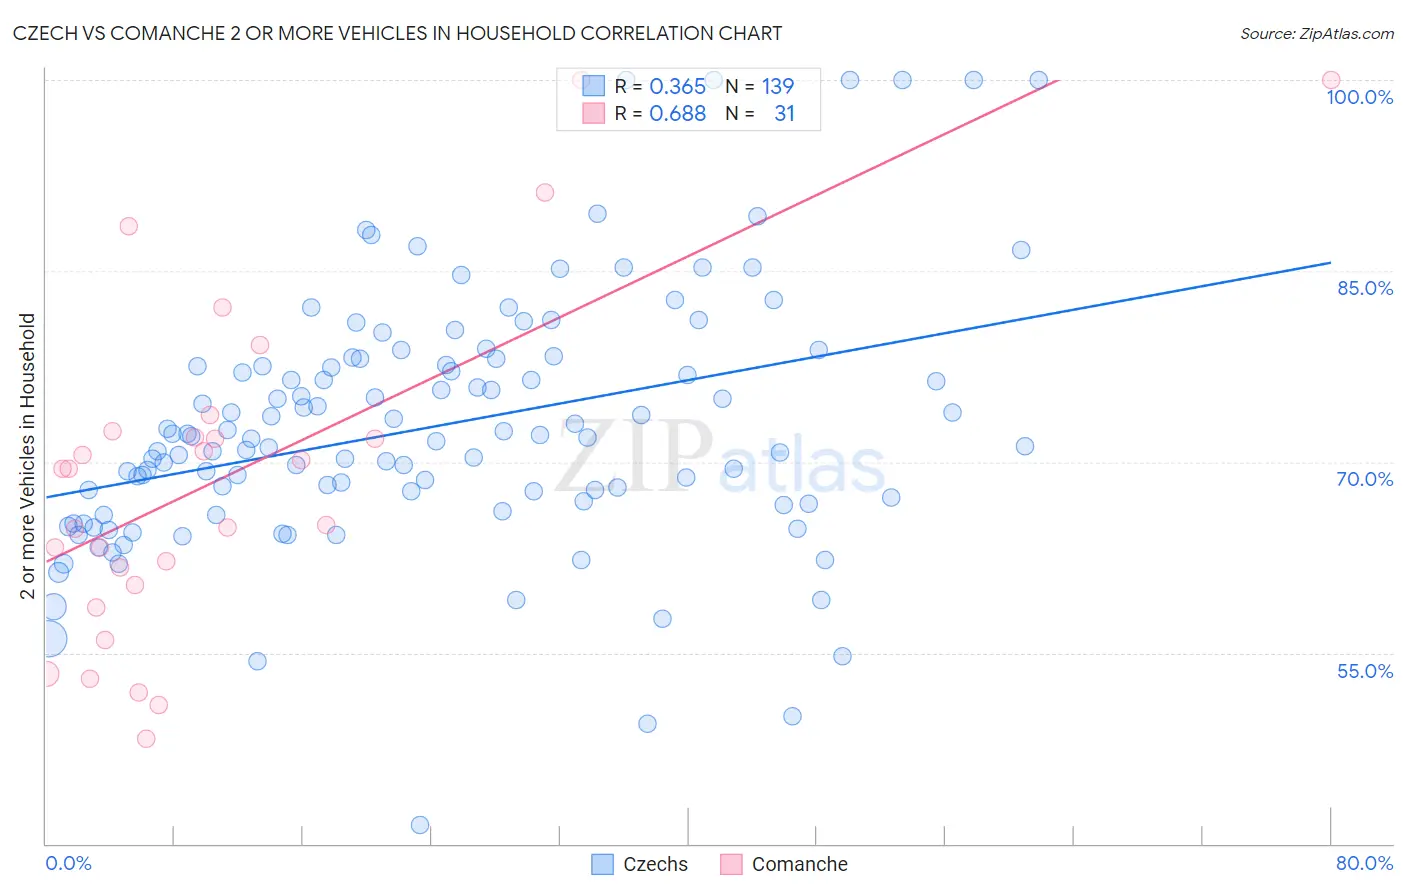
Czech vs Comanche 2 or more Vehicles in Household Correlation Chart
The statistical analysis conducted on geographies consisting of 484,510,183 people shows a mild positive correlation between the proportion of Czechs and percentage of households with 2 or more vehicles available in the United States with a correlation coefficient (R) of 0.365 and weighted average of 61.5%. Similarly, the statistical analysis conducted on geographies consisting of 109,768,112 people shows a significant positive correlation between the proportion of Comanche and percentage of households with 2 or more vehicles available in the United States with a correlation coefficient (R) of 0.688 and weighted average of 56.5%, a difference of 8.9%.
2 or more Vehicles in Household Correlation Summary
| Measurement | Czech | Comanche |
| Minimum | 41.5% | 48.2% |
| Maximum | 100.0% | 100.0% |
| Range | 58.5% | 51.8% |
| Mean | 72.7% | 68.7% |
| Median | 71.8% | 69.4% |
| Interquartile 25% (IQ1) | 66.7% | 60.3% |
| Interquartile 75% (IQ3) | 77.6% | 72.4% |
| Interquartile Range (IQR) | 10.9% | 12.1% |
| Standard Deviation (Sample) | 10.1% | 13.2% |
| Standard Deviation (Population) | 10.0% | 13.0% |
Similar Demographics by 2 or more Vehicles in Household
Demographics Similar to Czechs by 2 or more Vehicles in Household
In terms of 2 or more vehicles in household, the demographic groups most similar to Czechs are Samoan (61.5%, a difference of 0.050%), Nepalese (61.4%, a difference of 0.090%), Native Hawaiian (61.4%, a difference of 0.11%), German (61.6%, a difference of 0.16%), and Basque (61.4%, a difference of 0.18%).
| Demographics | Rating | Rank | 2 or more Vehicles in Household |
| Puget Sound Salish | 100.0 /100 | #7 | Exceptional 62.1% |
| English | 100.0 /100 | #8 | Exceptional 61.9% |
| Swedes | 100.0 /100 | #9 | Exceptional 61.8% |
| Mexicans | 100.0 /100 | #10 | Exceptional 61.7% |
| Dutch | 100.0 /100 | #11 | Exceptional 61.6% |
| Germans | 100.0 /100 | #12 | Exceptional 61.6% |
| Samoans | 100.0 /100 | #13 | Exceptional 61.5% |
| Czechs | 100.0 /100 | #14 | Exceptional 61.5% |
| Nepalese | 100.0 /100 | #15 | Exceptional 61.4% |
| Native Hawaiians | 100.0 /100 | #16 | Exceptional 61.4% |
| Basques | 100.0 /100 | #17 | Exceptional 61.4% |
| Europeans | 100.0 /100 | #18 | Exceptional 61.4% |
| Scottish | 100.0 /100 | #19 | Exceptional 61.2% |
| Sri Lankans | 100.0 /100 | #20 | Exceptional 61.0% |
| Koreans | 100.0 /100 | #21 | Exceptional 61.0% |
Demographics Similar to Comanche by 2 or more Vehicles in Household
In terms of 2 or more vehicles in household, the demographic groups most similar to Comanche are Hungarian (56.5%, a difference of 0.070%), Bulgarian (56.5%, a difference of 0.14%), Immigrants from the Azores (56.4%, a difference of 0.16%), Blackfeet (56.4%, a difference of 0.16%), and Yugoslavian (56.6%, a difference of 0.17%).
| Demographics | Rating | Rank | 2 or more Vehicles in Household |
| Estonians | 90.9 /100 | #126 | Exceptional 56.6% |
| Immigrants | Thailand | 90.7 /100 | #127 | Exceptional 56.6% |
| Immigrants | South Central Asia | 90.5 /100 | #128 | Exceptional 56.6% |
| Ute | 90.4 /100 | #129 | Exceptional 56.6% |
| Yugoslavians | 90.0 /100 | #130 | Exceptional 56.6% |
| Bulgarians | 89.7 /100 | #131 | Excellent 56.5% |
| Hungarians | 89.1 /100 | #132 | Excellent 56.5% |
| Comanche | 88.4 /100 | #133 | Excellent 56.5% |
| Immigrants | Azores | 86.6 /100 | #134 | Excellent 56.4% |
| Blackfeet | 86.5 /100 | #135 | Excellent 56.4% |
| Immigrants | Asia | 86.0 /100 | #136 | Excellent 56.3% |
| Cubans | 84.8 /100 | #137 | Excellent 56.3% |
| Salvadorans | 84.7 /100 | #138 | Excellent 56.3% |
| Armenians | 84.3 /100 | #139 | Excellent 56.3% |
| Latvians | 83.6 /100 | #140 | Excellent 56.2% |